The USDA’s latest World Agricultural Outlook Board report provided an update on soil moisture conditions in major and minor hay-producing areas of the U.S. As of April 26, about 9 percent of U.S. hay acreage was in areas experiencing drought. California and Nevada remain the states with areas of extreme drought.

Check out the hay areas under drought conditions (PDF, 3.9MB).
The USDA’s weekly crop progress report for the week ending April 24 indicated both topsoil and subsoil moisture conditions were improved from the previous week and corresponding week a year earlier. About 70 percent of cropland acreage was rated adequate for topsoil moisture, with 73 percent of acreage rated adequate for subsoil moisture. About 17 percent of topsoil acreage and 14 percent of subsoil acreage was rated very short or short of moisture, with the remainder (13 percent of topsoil and 10 percent of subsoil) rated as having surplus moisture.
Alfalfa
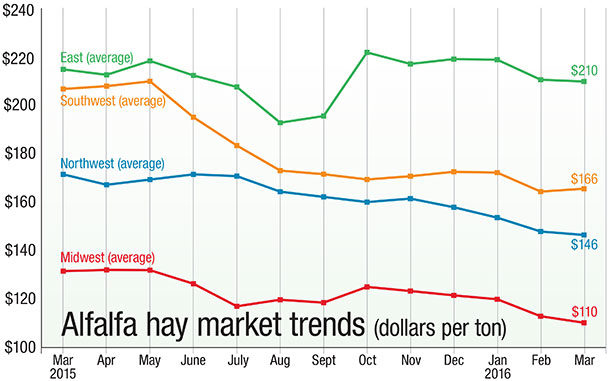
Alfalfa hay price changes were all over the board in March, with geography seemingly having little relevance, according to the USDA National Ag Statistics Service’s (NASS) monthly ag prices report, released April 29.
The March 2016 U.S. average price paid to alfalfa hay producers at the farm level was $144 per ton, up $2 from February, but $25 less than a year earlier.
Compared with a month earlier, average prices were up $30 per ton in Arizona and $20 per ton in Colorado and New York, but $10 to $15 per ton lower in Missouri, Nevada, Ohio, Pennsylvania and Washington.
Only Kentucky and New York reported higher prices than a year ago. Those two were also the only states with average prices higher than $200 per ton in March 2016.
Lowest reported alfalfa hay prices in March were in North Dakota ($75 per ton) and Minnesota ($85 per ton).
Other hay
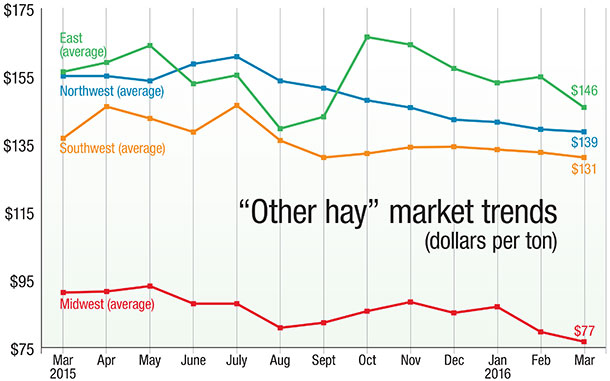
The U.S. average price for other hay was up $1 per ton to $126 per ton in March. Except for California, Oregon and Wyoming, Western other hay prices were slightly lower than the month before. Texas, Oklahoma and Arizona, Kentucky and Ohio saw prices higher than a year ago.
Dairy outlook: More cows, more milk
The USDA’s monthly milk production report shows the “spring flush” got an early start in the North.
Nationally, March 2016 milk production was estimated at 18.41 billion pounds, up 1.8 percent from a year earlier. The increase was built on more cows, up 14,000 compared with a year earlier and 10,000 more than February 2016.
Compared with the previous month, March cow numbers were up in Texas (plus 3,000), Arizona, Idaho and Michigan (plus 2,000 each) and Kansas (plus 1,000).
Largest year-over-year gains in milk production were primarily in the northern tier of the states, stretching from New York to South Dakota.
Further west, ongoing production trends continued. California’s March milk production was down, with fewer cows and less milk output per cow. New Mexico, still feeling the impact of Winter Storm Goliath, saw fewer cows and only a small boost in output per cow. Texas cow numbers remained below year-ago levels, offsetting an increase in milk production per cow.
Most price forecasters predict a slow increase in milk prices later in the year, but expect prices to remain relatively low.
Read: “Milk concerns swirling around spring flush”
Average milk income-over-feed-cost margin levels were squeezed further in March, with slightly higher alfalfa hay and soybean prices compounding the impact of lower milk prices. The U.S. average milk price was $15.30 per hundredweight in March, the lowest since May 2010.
Based on Margin Protection Program for Dairy (MPP-Dairy) calculations, March 2016 average feed costs were $7.83 per hundredweight, leaving an income-over-feed-cost margin of $7.47 per hundredweight, the slimmest since July 2015. Current projections by the Program on Dairy Markets and Policy, MPP-Dairy margins could dip below $6.50 per hundredweight in April-July 2016, before trending higher later in the year.
China, UAE help boost U.S. hay exports
With China and the United Arab Emirates (UAE) as more active buyers, February U.S. alfalfa hay and other hay exports were the highest since November 2015, according to the USDA’s Foreign Ag Service.
Read: “China, UAE help boost U.S. hay exports”
February 2016 alfalfa hay exports were estimated at 175,962 metric tons, up more than 24,350 metric tons from January. Exports of alfalfa cubes were down slightly from January, but alfalfa meal exports were up.
Chinese alfalfa hay shipments totaled 76,790 metric tons in February, up nearly 30,000 metric tons from both January 2016 and February 2015.
With the higher volume, the value of alfalfa hay exports also rose. February exports were valued at $54.2 million, up from $38.5 million a year earlier. Exports of other hay were valued at $37.3 million, up from $36.3 million a year earlier.
Hay exports have shown a relatively strong start to the year, according to the Northwest Farm Credit Services Hay Market Snapshot. Hay shipments from California ports continue to increase at a faster pace.
Maritime rules create a weighty issue
Interpretation and implementation of new shipping requirements are creating questions for hay exporters.
Starting July 1, the International Convention for the Safety of Life at Sea requires shippers be more exact in verifying shipment weights. More accurate weights are seen as a means to protect ships, crews and cargoes from overcapacity conditions.
At issue is who is liable for verifying the weight of containers before they are loaded onto ocean vessels carrying goods abroad.
Documentation must include verified weights of packed containers, either by weighing the packed container or by adding the weight of the cargo to the weight of the container. Weights would be certified by state authorities where the container is packed.
Critics of the requirements say port disruptions and slowdowns could result.
“As it stands now, there is more confusion than clarity, so more time is needed to understand ultimate impact to the hay industry and exports in general,” said Mark T. Anderson, CEO and president of Anderson Hay & Grain Co. Inc.
Figures and charts
The prices and information in Figure 1 (alfalfa hay market trends) and Figure 2 (“other hay” market trends) are provided by NASS and reflect general price trends and movements. Hay quality, however, was not provided in the NASS reports.
For purposes of this report, states that provided data to NASS were divided into the following regions:
Southwest – Arizona, California, Nevada, New Mexico, Oklahoma, Texas
East – Kentucky, New York, Ohio, Pennsylvania
Northwest – Colorado, Idaho, Montana, Oregon, Utah, Washington, Wyoming
Midwest – Illinois, Iowa, Kansas, Michigan, Minnesota, Missouri, Nebraska, North Dakota, South Dakota, Wisconsin FG

-
Dave Natzke
- Editor
- Progressive Forage Grower
- Email Dave Natzke