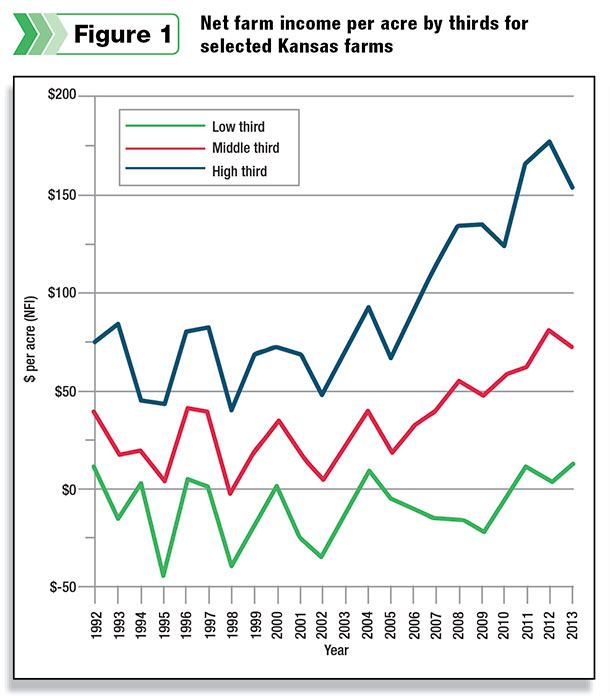
Figure 1 lists the net farm income of these forage-based farms from the Kansas Farm Management Analysis (KFMA) program. Each year, the farms are ranked in order of profitability based on net income per acre, and the median value of the upper-third, the middle-third and the lower-third set of farms are plotted in Figure 1.
As can be seen in the figure, the lower-third set of farms basically break even, the middle third set earns around $50 per acre, and the top third earns around $100 per acre.
From 2007 through 2013, profitability of the top two-thirds of farms has increased, with the top third increasing the most. The range of profitability is thus greater than it has ever been, with the lowest-profitable farms struggling to break even and the highest profitable farms earning record profits.
This increase in profitability has all come from higher output prices as the cost of production since 2006 for forage-based farms has increased fairly dramatically.
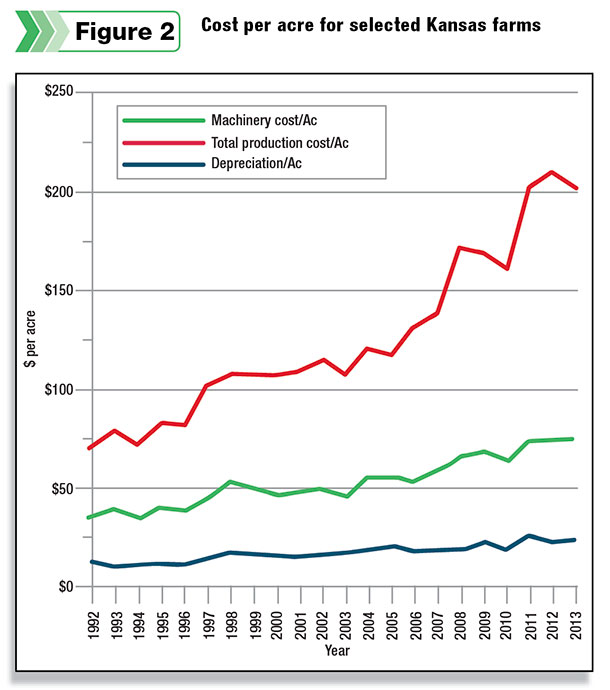
Figure 2 shows the median cost of production per acre for KFMA forage-based farms since 1992. The red line is the total production cost per acre and includes machinery operating costs and also depreciation. The green line represents total machinery costs per acre, which also includes depreciation.
The blue line represents the depreciation cost per acre. KFMA analysis uses management depreciation throughout the calculations. KFMA management depreciation is a formula-driven number that is supposed to better represent the actual decline in asset value than does any of the tax depreciation methods.
The flatness of the depreciation-per-acre line in Figure 2 is an indication that farmers have not gone overboard with their equipment purchases over the last several years.
During periods of high net income, it is always tempting for farmers to lower their taxable income by buying equipment. The section-179 deduction has encouraged this practice by allowing farmers the opportunity to deduct most of the purchase price as a depreciation expense in the year the new asset is purchased.
However, buying equipment just to lower taxes is seldom a good business practice. Accelerated depreciation results in less depreciation the following years of the asset life. Additionally, when the asset is sold, the remaining value of the asset results in a recapture of depreciation, which is taxed at ordinary tax rates.
Equipment prices have gone up in the time frame shown in Figure 2, but the overall depreciation expense per acre is still relatively low. The gradual increase in depreciation expense per acre probably represents the rate of increase in the cost of new equipment rather than any change to the mix of equipment on a farm.
Of more concern to farmers should be the dramatic increase in other production costs outside of machinery expenses. These have increased from $75 per acre in 1992 to more than $200 in 2013.
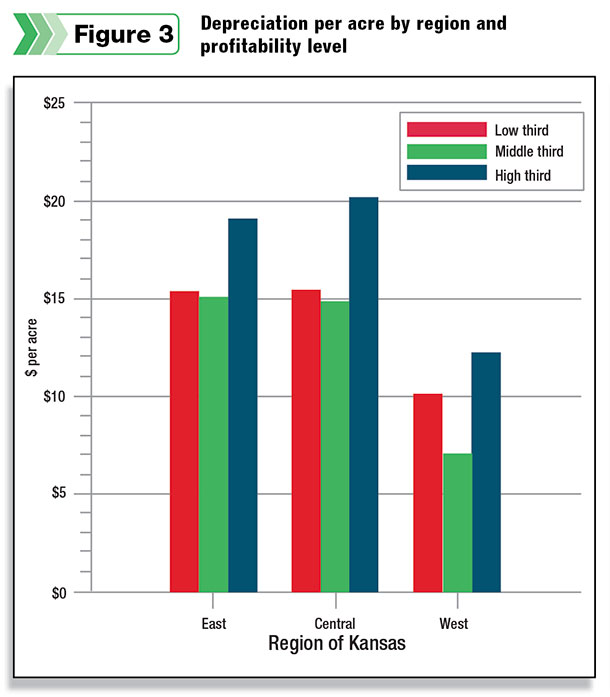
Depreciation expenses do vary by geography and by the profit level of a farm. Because management depreciation is being used in the KFMA analysis, depreciation also has a direct correlation to the machinery investment per acre. These characteristics are shown in Figure 3.
The east and central regions of Kansas have the highest depreciation cost per acre, while the west has the lowest. This is to be expected, as the east and central areas have much more rainfall and are thus able to be farmed more intensively.
Another characteristic of KFMA farms relating to geography is farm size. Those forage-based farms in the west are roughly twice as large as the central and eastern farms. The central and eastern farms are similar in size.
This size difference is another possibility for why west Kansas farms have lower depreciation costs per acre and thus less machinery investment per acre.
These larger farms may have larger equipment that allows them to cover more acres with a smaller per-acre equipment cost.
The other characteristic of depreciation (as shown in Figure 3) is the depreciation per acre based on farm profitability. The most profitable third of farms have greater depreciation costs per acre than do the middle-third and lower-third profitable farms.
This characteristic holds for all three areas of the state. The middle-third and lower-third profitable farms tend to have similar depreciation costs per acre, but the lower-third profitable farms tend to have a slightly higher depreciation cost when compared to the middle-third profitable farms.
One possible explanation for why the high third of farms has the greatest depreciation cost per acre might be that these farms have the best land and thus are able to use their land more intensively.
A more intensive use of farmland would then result in a greater use of farm machinery per acre and a corresponding higher depreciation cost per acre.
This explanation fails to explain why the lower third of farms has slightly higher depreciation costs per acre when compared to the middle third of farms.
For this explanation of machinery use based on land productivity to hold, the middle third of farms should have greater depreciation than the lower third of farms.
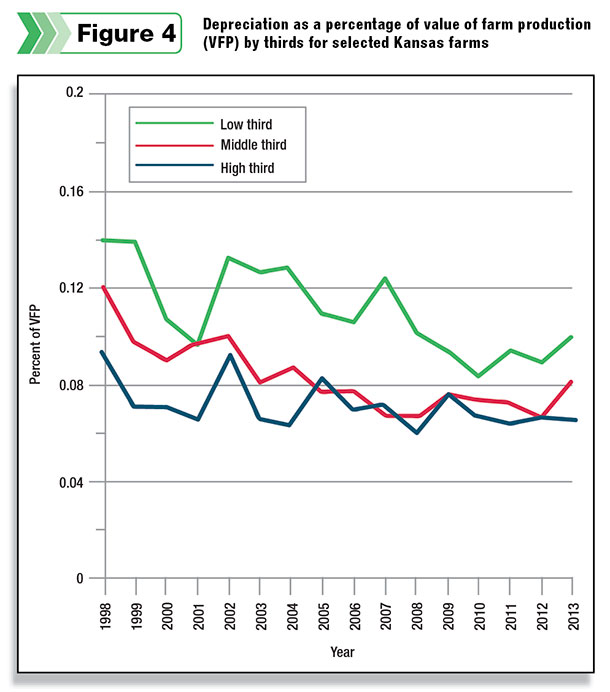
A better explanation of the differences between farmer profitability and depreciation costs per acre can be inferred from Figure 4.
In this figure, depreciation is plotted as a percentage of the value of farm production (VFP) for the three groups of farmer profitability. Value of farm production is a measure of the gross farm revenue that is actually produced on the farm.
As shown, depreciation as a percentage of value of farm production has remained fairly consistent across time, but there are differences among the profitability thirds.
The most profitable third of Kansas forage-based farms have the lowest percentage of depreciation to VFP despite having the highest depreciation cost per acre. This is a definite indication of these farms having better land. The least profitable third of farms have the greatest percentage of depreciation to VFP – again, an indication of land productivity.
The middle profitable third of farms is where the analysis is interesting. These farms have a similar percentage of depreciation to VFP as do the most profitable farms. In addition, the middle-third set of farms also has the lowest depreciation costs per acre.
This leads to one of two conclusions: Either the middle third of farms is doing a better job managing their equipment, or the upper third of farmers has been somewhat overspending on equipment.
This conclusion is based on Figures 3 and 4, where either the middle-third or the upper-third set of farms doesn’t fit the pattern of the other two groups.
Going forward, forage-based farms should probably worry more about controlling expenses other than machinery. Buying machinery is certainly expensive, but the depreciation cost on a per-acre basis is relatively small. FG
Gregg Ibendahl
Department of Ag Economics
K-State Research and Extension