At first glance, this seems counterintuitive given that rural populations are more spread out and, indeed, the early infection hot spots in the U.S. were all based in large cities, including especially New York City. This is also where the more rapid daily increases have been observed to date.
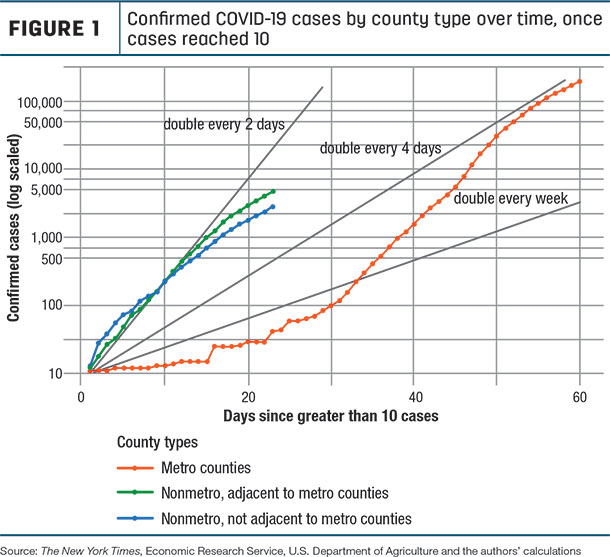
Data compiled since February of this year by The New York Times show that the virus not only is starting to spread in rural areas but that it is now growing dramatically more rapidly than was the case in metro areas at a comparable stage (once a total of 10 cases occurred, see Figure 1). In this figure, we show rates in metro areas, and we separate non-metro areas into those that are and are not adjacent to metro areas.
A number of possible causes for this trend are being discussed. Rural communities have more older residents with chronic diseases, who are more susceptible to viral diseases. In comparison to metro areas, non-metro area residents have a higher rate of heart and chronic lower respiratory diseases and cancer, and are more likely to smoke. Many rural areas are also tourism hot spots, such as Blaine County (Idaho), Summit County (Utah) or Eagle County (Colorado), which led to an initial surge of disease spread.
Even though many rural residents are isolated, they need to drive to larger cities for their jobs, business, medical treatment and entertainment, which potentially exposes them to the virus. Anecdotal evidence suggests rural residents socialize more even though (or because) they live in lower-density areas, e.g., in churches and choir practices, and community social events, all of which are conducive to spreading the disease.
Figure 1 shows that while the disease arrived later in non-metro or rural areas, the rural caseload growth is now such that it doubles every two to three days. In contrast, urban cases are doubling, from a higher base or total number, every four days. Also noteworthy in Figure 1 is that the line for metro-non-adjacent rural counties is now below that for adjacent counties (after starting out above it), suggesting that social distancing may be having a greater impact there.
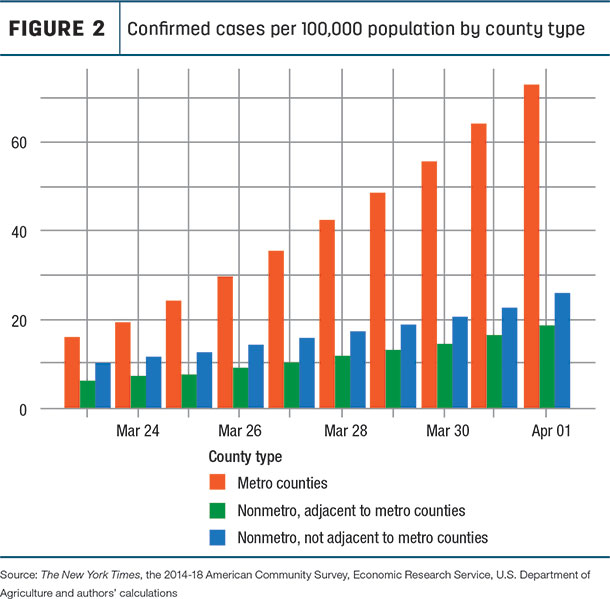
Even as rural cases grow rapidly, they are still far behind urban cases on a per capita basis (Figure 2). Non-metro areas include just over 46 million residents or 14% of the total U.S. population; of these 46 million, about 30 million are in metro-adjacent rural counties and about 16 million are in metro-non-adjacent rural counties. As of this writing, there are on average 73.2 positive cases per 100,000 population in metro areas compared with 18.7 in metro-adjacent non-metro counties and 26 cases per 100,000 in metro-non-adjacent counties (indicating a higher attack rate there).
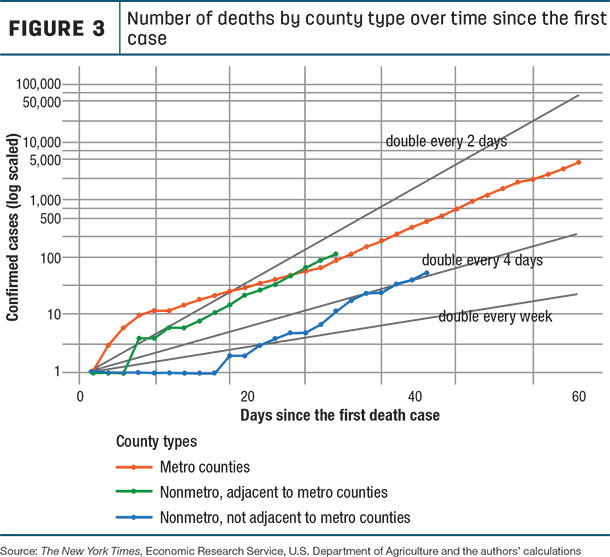
A somewhat different picture emerges for the growth in death rates (Figure 3). In non-metro counties that are not adjacent to metro counties, these double about every four days, while that is closer to every three days in metro counties and in counties that are adjacent to metro areas.
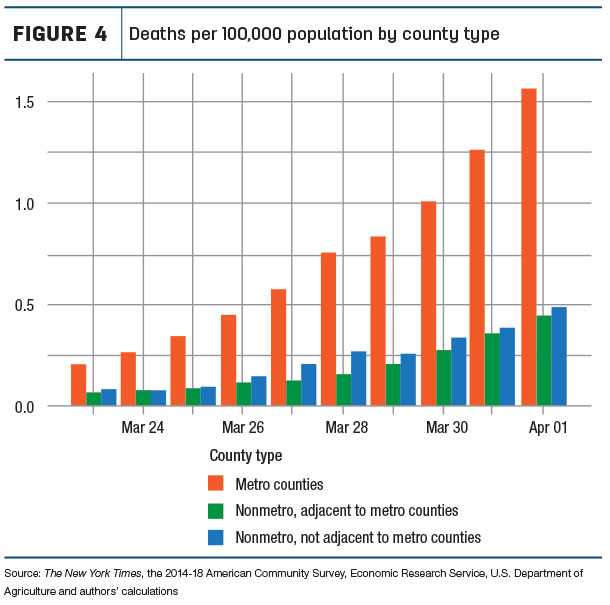
There is a growing discrepancy in the number of deaths per capita in the two non-metro region types, and both of these rates are catching up with those in urban areas (Figure 4).
The road ahead: One critical question is how rural medical services will be able to cope with the growing number of positive cases and individuals who require intensive care. Another is, how quickly will they be able to flatten their curves through social distancing and related strategies. ![]()
References omitted but are available upon request. Click here to email an editor.
S.J. Goetz, Z. Tian, C. Schmidt and D. Meadowcroft are with the Northeast Regional Center for Rural Development and/or Penn State University.
This originally appeared in the Northeast Regional Center for Rural Development COVID-19 Issues Brief No. 2020-3, April 3, 2020 (revised April 9, 2020)