“There remains a buildup of world dairy stocks that need to be worked off before world prices increase and before we can expect improvement in U.S. dairy exports. U.S. also can expect to see strong competition for markets from the EU and New Zealand. How soon world stocks are reduced will depend upon what happens to milk production in the EU and New Zealand. While EU dairy producers have faced financial stress from low milk prices, many have geared up for more milk production with the elimination of quotas last April. New Zealand dairy producers facing low milk prices have reduced cow numbers, and El Nino may produce drought conditions that impact milk production. There are estimates that New Zealand milk production could be down as much as 7 to 10 percent for the July 2015 to June 2016 production year.”

All milk prices (actual receipts) in December 2015 were down across all reporting states from $18.20 to $17.20 per hundredweight (cwt), according to the USDA National Agricultural Statistics Service (NASS) report of Jan. 29, 2016.
Market conditions reported Dec. 31, 2015
Average actual prices received for December 2015 flatlined, reflecting stockpiles of feeder quality hay. While prices on alfalfa hay increased in New York by 13 percent, Michigan took a 20 percent decrease on alfalfa hay. Little change was reflected in other state prices.
“Other hay” didn’t reflect much better. There was a more than 2 percent increase in actual prices received, with Oklahoma (22 percent increase) and Illinois (10 percent increase) showing the largest gains. Again, Michigan took a 24 percent decrease in pricing in “other hay,” leading the decrease but followed again by Nevada (10 percent decrease) and New York (11 percent decrease).
Not many bright spots out there in the hay market for December actual prices received.
2015 production statistics by state
The 2015 hay production statistics were released in January by USDA NASS. Highlights of that report show production of all dry hay for 2015 is estimated at 134 million tons, down 6 percent from the Oct. 1 forecast and down 4 percent from the revised 2014 total. The area harvested is estimated at 54.4 million acres, down 4 percent from the Oct. 1 forecast and down 5 percent from 2014. The average yield, at 2.47 tons per acre, is down 0.05 ton from the Oct. 1 forecast but up 0.02 ton from the previous year.
Alfalfa and alfalfa mixtures:
Production in 2015 is estimated at 59 million tons, down 7 percent from the Oct. 1 forecast and down 4 percent from the revised 2014 total. Harvested area, at 17.8 million acres, is down 3 percent from the Oct. 1 forecast and 3 percent below the previous year. Average yield is estimated at 3.32 tons per acre, 0.13 ton below the Oct. 1 forecast and down 0.02 ton from 2014.
Alfalfa production was generally down across the nation in 2015, as a result of lower yields compared with 2014.
All other hay:
Production in 2015 totaled 75.4 million tons, down 5 percent from the Oct. 1 forecast and down 4 percent from the revised 2014 total. Harvested area, at 36.7 million acres, is down 4 percent from the Oct. 1 forecast and down 5 percent from last year. Average yield is estimated at a record-high 2.06 tons per acre, down 0.01 ton from the Oct. 1 forecast, but up 0.03 ton from the previous year. Good moisture during the growing season was beneficial. Record-high yields are estimated in Alabama, Illinois, Missouri, Nevada and Wyoming.
Watch our Progressive Forage Grower March issue for a forage statistics poster that showcases a complete rundown on forage production by state.
Weather
For the week of Jan. 17-23, the U.S. drought monitor map finally showed shrinking exceptional and extreme drought through California and Nevada. While not extirpated, the drought seems to be losing its grip; at the same time, the Sierra Nevada snowpack rose to nearly 120 percent for normal. The week’s end shifted weather extremes to blizzards across the eastern U.S., leaving heavy snow across the central Appalachians and interior Southeast.
Exports
November 2015 export reports newly reported from the USDA Foreign Agricultural Service showed a slight gain of 5 percent on hay exports to the top six U.S. trading partners. Exports to China increased 3 percent (to 76,885 metric tons), and exports to South Korea (26 percent increase to 58,871 metric tons), Taiwan (11 percent increase to 13,709 metric tons) and Saudi Arabia (22 percent increase to 14,747 metric tons) were other bright spots on the export scene. United Arab Emirates (UAE) exports fell by 27 percent, and a distant volume partner (Canada) fell by 38 percent, to 4,280 metric tons.
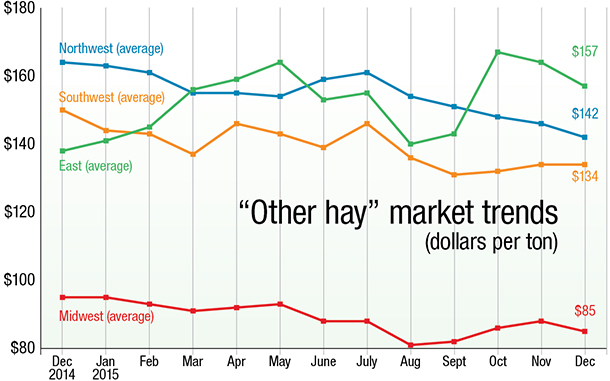
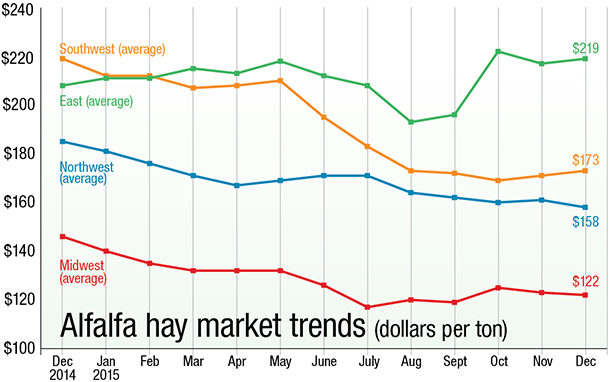
Trending charts
Several forces can impact hay market trends – hay quality, interest rates, feed commodity prices, oil prices, crop input costs, weather, transportation costs, milk prices, inflation and international issues. The best way to understand market fluctuations is to study trends in relation to such events. There is value in keeping track of upswings and downturns over several months (or years) to help with buying and selling decisions. Thus, trends may become a critical barometer for producers, brokers, dairymen and livestock producers.
Furthermore, hay markets vary widely by region and by product – alfalfa hay versus “other hay.” The prices and information in Figure 1 (alfalfa hay market trends) and Figure 2 (“other hay” market trends) are provided by NASS and reflect general price trends and movements. Hay quality, however, was not provided in the NASS reports.
For purposes of this report, states that provided data to NASS were divided into the following regions:
Southwest – Arizona, California, Nevada, New Mexico, Oklahoma, Texas
East – Kentucky, New York, Ohio, Pennsylvania
Northwest – Colorado, Idaho, Montana, Oregon, Utah, Washington, Wyoming
Midwest – Illinois, Iowa, Kansas, Michigan, Minnesota, Missouri, Nebraska, North Dakota, South Dakota, Wisconsin FG


