Major hay-purchasing sectors, dairy and beef, just came through a summer of very tight income margins, with dairy starting to show some signs of life.

USDA’s latest farm income projections, released in late August, estimate the nation’s hay producers will generate $7.1 billion in 2016 in cash receipts, up slightly from 2015, but the second lowest total since 2011.
Meanwhile, hay harvest continues, with corn silage chopping getting an early start in some regions. Hampered by weather, several areas report a scarcity of dairy-quality hay and demand for lower-quality hay as light.
Here’s a snapshot of factors impacting hay producers as the calendar turns to September.
Drought area a little smaller
USDA’s latest World Agricultural Outlook Board report indicates drought conditions improved slightly in some major hay-producing states in the Midwest, but deteriorated in the Northeast. There was little month-to-month change in the West, which continues to face dry conditions. As of Aug. 30, about 14 percent of U.S. hay acreage was located in areas experiencing drought.
Check out the hay areas under drought conditions.
Hay production estimates begin
With autumn here, USDA has begun crop production estimates, with an update scheduled in mid-September. As of early August, 2016 acreage, average yields and production of alfalfa and alfalfa-mixture dry hay were forecast higher than a year ago. Favorable conditions in the Corn Belt had producers expecting improved yields, and record-high yields were expected in Indiana and Washington.
Production of other hay was also forecast higher, with national average yields expected to be a record high and total production behind only 2004 and 2003.
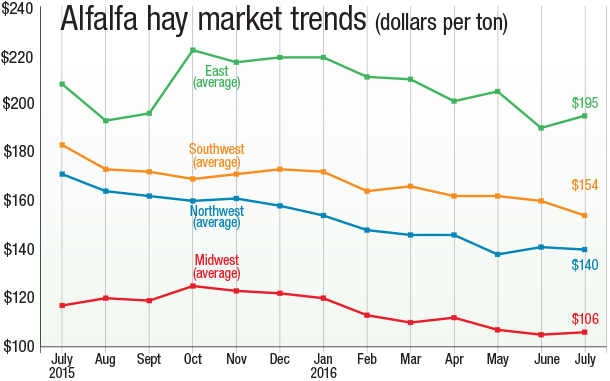
July alfalfa hay prices hit 66-month low
That higher production has an impact, and alfalfa and other hay prices continue to slide, according to the USDA National Ag Statistics Service’s (NASS) monthly ag prices report, released Aug. 31.
Alfalfa
The July 2016 U.S. average price paid to alfalfa hay producers at the farm level was $140 per ton, down $2 from June and $32 less than a year earlier. Based on USDA records, U.S. average alfalfa prices are the lowest since February 2011.
Of the major reporting states, only five – Michigan, Nebraska, North Dakota, Ohio and Wyoming – reported higher alfalfa hay prices compared to a month earlier. Michigan and Ohio prices were up $35 and $30 per ton, respectively. Highest average prices were in Kentucky and Ohio, $220 and $200 per ton, respectively.
Largest month-to-moth declines were in Oklahoma and Wisconsin. Regionally, the Southwest region saw the largest overall month-to-month decline (Figure 1).
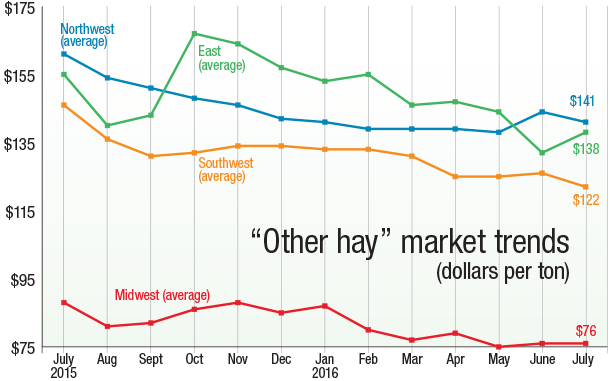
Other hay
The July U.S. average price for other hay was $113 per ton, down $3 from June and $7 per ton less than a year earlier.
Regionally, prices for other hay were up in the East, but steady to lower elsewhere (Figure 2). Ohio posted the largest month-to-month increase, up $35 per ton from June. Oklahoma and Wisconsin saw the largest declines, down $16 and $18 per ton, respectively.
U.S. alfalfa product export values suffer
With lower hay prices, U.S. exports of alfalfa and other hay-related products are suffering from lower values despite moving fairly strong volumes, according to the latest estimates from USDA’s Foreign Ag Service.
June exports of alfalfa hay topped 200,450 metric tons, down about 12,000 metric tons from May 2016, but about 40,000 metric tons more than June 2015. Total June values were estimated at $59.5 million, about $4 million less than a month earlier.
Chinese alfalfa hay shipments totaled 101,591 metric tons in June, up substantially from previous months and a year ago. Japan and Saudi Arabia also posted gains from a year ago.
June exports of other hay and alfalfa cubes were the lowest of the year, but shipments of alfalfa meal were the highest of the year. Lower prices hampered export values across the board.
Dairy outlook: Lower feed prices boosting dairy margins
On the demand side back home, lower feed costs and higher milk prices are improving dairy producer income margins.
At $16.60 per cwt, the July U.S. average milk price was the highest since January. USDA’s Farm Service Agency (FSA) calculated a July margin of $7.59 per hundredweight (cwt), compared to just $5.76 per cwt in May-June. Aided by lower hay prices, final feed costs averaged $8.51 per cwt nationally, resulting in the highest monthly income margin since February. Based on current futures prices, dairy margins are forecast to move higher through the end of the year.
Dairy cow numbers, milk per cow and total milk production continue to increase. In July, milk cow numbers were estimated at 9.332 million head, 18,000 head more than July 2015, and up 2,000 head from June 2016.
Clouding the picture are building cheese and butter inventories, low global dairy prices and continued export weakness.
Beef cattle outlook: Prices, margins squeezed
Lower hay and other feed prices provided minimal relief for beef producers, who saw cattle prices continue to decline. July steer and heifer prices were down $30 per cwt compared to a year earlier.
The lower prices are being driven by larger supplies, which are expected to continue well into 2017. Cattle and calves on feed in U.S. feedlots with capacity of 1,000 or more head totaled 10.2 million head on Aug. 1, up about 2 percent compared to a year earlier. July placements totaled 1.57 million head (1.52 million net), also up 2 percent from a year earlier.
Monthly fed cattle marketings totaled 1.71 million head, 1 percent less than July 2015 and the lowest July total since USDA began reporting those numbers in 1996. In addition to lower beef prices, one of the factors for the slower marketings is that lower feed prices are encouraging producers to keep cattle on feed longer, and slaughter carcass weights are on the rise.
Figures and charts
The prices and information in Figure 1 (alfalfa hay market trends) and Figure 2 (“other hay” market trends) are provided by NASS and reflect general price trends and movements. Hay quality, however, was not provided in the NASS reports.
For purposes of this report, states that provided data to NASS were divided into the following regions:
Southwest – Arizona, California, Nevada, New Mexico, Oklahoma, Texas
East – Kentucky, New York, Ohio, Pennsylvania
Northwest – Colorado, Idaho, Montana, Oregon, Utah, Washington, Wyoming
Midwest – Illinois, Iowa, Kansas, Michigan, Minnesota, Missouri, Nebraska, North Dakota, South Dakota, Wisconsin ![]()

-
Dave Natzke
- Editor
- Progressive Forage
- Email Dave Natzke