That is a lot considering the U.S. produced 117.85 million tons of corn silage in 2013.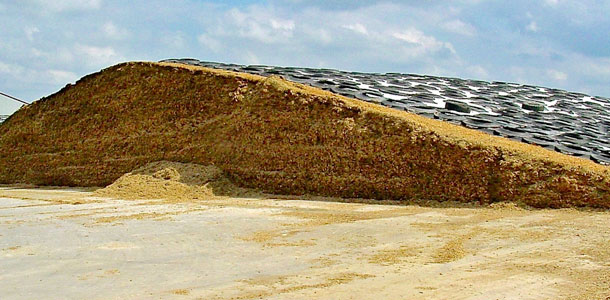

A properly shaped “drive-over” pile of corn silage is shown in Figure 1. The front, back and sides all have a maximum slope of 1 to 3. This means that for every 1 foot of vertical, there are 3 feet of horizontal.
Many producers who disregard the 1-to-3 rule are trying to put too much silage into too small a space or footprint.
As a result, these “push-up” piles have side slopes of 1 to 1.5 or less and can tower 20 to 25 feet or more above the ground.
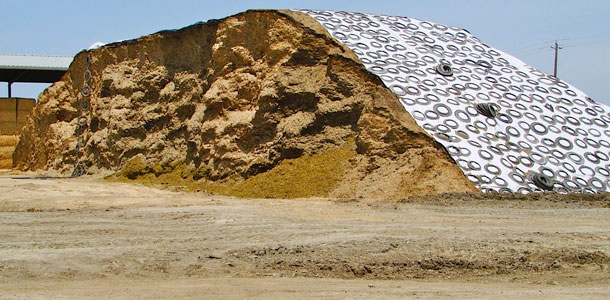
In addition to being unsafe, the tractor operator cannot pack the side and back slopes of a push-up pile, Figure 2.
This results in low-density silage, large amounts of visible surface spoilage, especially on the sides and high dry matter (DM) losses.
When it is suggested that producers find the additional space and make two drive-over piles, their answer is, “I cannot afford to take land out of production.” This is simply not true. Here’s the how and why:
By taking a small amount of land out of production in order to increase the footprint for a second drive-over pile, producers will actually have more corn silage to feed than if they continue to grow corn on it.
A larger footprint and two properly sized and shaped drive-over piles will significantly decrease DM loss and dramatically increase net tons of corn silage to feed.
Let’s put pencil to paper and walk through two case-study dairies to illustrate what happens when acreage is removed from production to provide a larger footprint to store corn silage.
For both case studies, let’s assume that a typical forage grower can produce 24 tons of corn silage per acre in a growing year.
Where it is possible to double crop with winter forage, such as wheat or triticale harvested in the spring followed by corn, let’s assume a grower can produce 38 tons of forage per acre.
Case Study #1
Original Pile A. 1-acre push-up pile with 1-to-1.5 slopes on all four sides on a 120 foot x 375 foot base x 22 foot maximum height x 42 pounds fresh weight density = 14,211 tons x 82 percent recovery = 11,653 net tons of corn silage to feed
New Pile B. 1-acre drive-over pile with 1-to-3 slopes on all four sides on a 120 foot x 375 foot base x 14 foot maximum height x 48 pounds fresh weight density = 9,341 tons x 88 percent recovery = 8,220 net tons of corn silage to feed
Pile A = 14,211 tons
Pile B = 9,341 tons
4,870 tons difference
New Pile C. 0.65-acre drive-over pile with 1-to-3 slopes on all four sides on a 84 foot x 348 foot x 14 foot maximum height x 48 pounds fresh weight density = 4,870 tons x 88 percent recovery = 4,285 net tons of corn silage to feed
Pile B + Pile C = 12,505 net tons
Pile A = 11,653 net tons
852 net tons advantage for a 1.65-acre footprint versus 1-acre footprint
In this first case study, a footprint of 1.65 acres versus 1 acre reduced the dairy’s corn silage DM loss by 852 tons. At $65 per ton, that is $55,380 of corn silage saved.
By making two properly sized and shaped drive-over piles on a larger footprint, assuming a corn silage yield of 24 tons per acre, the dairy reduced its DM loss by 35.5 acres of corn.
In other words, the dairy in this example is losing 35.5 acres of corn to DM loss by making one large push-up pile instead of two smaller drive-over piles.
In a double-cropping scenario with a forage yield of 38 tons per acre, the dairy reduced its DM loss by 22.4 acres. In some areas of the country, the water required to produce 852 tons of forage could be diverted to another agriculture use.
Case Study #2
Original Pile D. 0.5-acre push-up pile with 1-to-1.5 slopes on all four sides on a 90 foot x 250 foot base x 20 foot maximum height x 42 pounds fresh weight density = 5,847 tons x 80 percent recovery = 4,678 net tons of corn silage to feed
New Pile E. 0.5-acre drive-over pile with 1-to-3 slopes on all four sides on a 90 foot x 250 foot base x 14 foot maximum height x 48 pounds fresh weight density = 3,812 tons x 88 percent recovery = 3,355 net tons of corn silage to feed
Pile D = 5,847 tons
Pile E = 3,812 tons
2,035 tons difference
New Pile F. 0.33-acre drive-over pile with 1-to-3 slopes on all four sides on a 72 foot x 205 foot x 12 foot maximum height x 48 pounds fresh weight density = 2,035 tons x 88 percent recovery = 1,791 net tons of corn silage to feed
Pile E + Pile F = 5,146 net tons
Pile D = 4,678 net tons
468 net tons advantage for a 0.83-acre footprint versus 0.5-acre footprint
In this second case study, a footprint of 0.83 acre versus 0.5 acre reduced the dairy’s corn silage DM loss by 468 tons.
At $65 per ton, that is $30,420 of corn silage saved. By making two properly sized and shaped drive-over piles on a larger footprint, assuming a corn silage yield of 24 tons per acre, the dairy reduced its DM loss by about 19.5 acres of corn. In a double-cropping scenario, the dairy reduced its DM loss by 12.3 acres.
Safety and efficiency
Taking an acre (or part of an acre) out of production to ensure a safe and efficient silage program makes good economic sense.
The relationship between safety and efficiency in managing drive-over piles (and bunker silos) could not be stronger. Not only will producers be gaining more tons of silage than that acre can produce, they will also be protecting their employees.
The peace of mind in knowing there is a better chance of sending employees home safe and sound every day is priceless. FG
For more information, contact Keith Bolsen at (512) 301-2281, or Ron Kuber at (559) 779-5961.
Ron Kuber is president of Connor Marketing Inc. in Clovis, California.
PHOTOS
TOP: A properly shaped drive-over pile of corn silage with 1-to-3 slopes.
BOTTOM: A push-up pile of corn silage with 1 to 1.25 side and back slopes. Photos courtesy of Keith Bolsen.