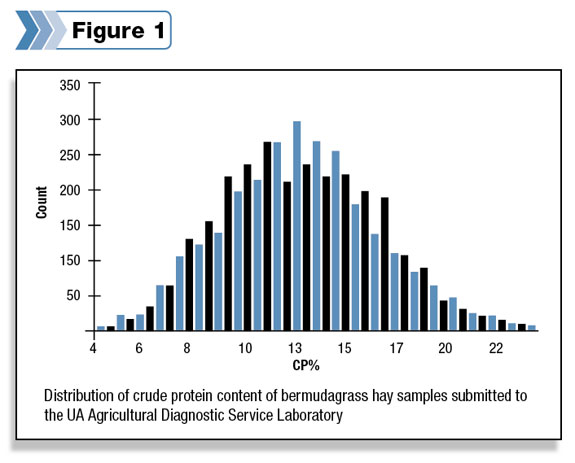
Bermudagrass samples submitted to the University of Arkansas Agricultural Diagnostic Lab illustrate this point (Figure 1).

Bermudagrass hays ranged from 6 to 22 percent protein.
Utilization of the Arkansas average protein content of 13 percent for bermudagrass could result in underfeeding protein in some situations.
An evaluation of hay samples collected over a five-year period from farms participating in the Arkansas Beef Improvement Program (ABIP) indicates that hay quality can be highly variable from year to year.
A statistical measure often used for quality control is called coefficient of variation (CV). Large CVs indicate a lot of variation or poor consistency.
Coefficients of variation smaller than 10 are desirable. Arkansas Beef Improvement Program data indicates protein may be more variable than fiber.
Ninety percent of the farms had a CV greater than 10 percent for protein, and 40 percent of the farms had a CV greater than 10 percent for acid detergent fiber, which affects the digestibility of forages. High variability in hays, even among hays produced on a single farm, makes annual testing important.
Tips for collecting forage samples
The analyzed nutrient composition of hay is only as accurate as the sample sent.
Begin by accurately identifying the dominant forage species of the field harvested to get an accurate estimate of total digestible nutrients (TDN).
Test each lot of hay. A lot represents hay harvested from each cutting within a single field under similar harvest conditions.
Harvest date, plant species, fertility and weather can all result in variations within and between fields and cuttings
. If testing each lot of hay is impractical, testing across hay lots is the next best approach.
For mixed lot sampling, the combined sample should contain each lot’s proportion relative to the whole. If lot 1 contains 15 percent of the total number of bales, then it should also represent 15 percent of mixed lot sample. Otherwise, forage quality will be interpreted inaccurately.
Core samples are preferred over grab samples. Even with hay that is not weathered, multiple core samples will contain a better distribution of plant material, which will result in a more accurate assessment of nutrient composition. Samples should be taken from the end of square bales and from the side of round bales and stacks.
Twenty to 30 percent of the bales must be sampled to accurately estimate the nutrient composition of the hay. A demonstration project at the University of Arkansas showed differences of 5 percent TDN when as few as 5 percent of bales were sampled within a single hay lot.
A minimum of six individually core-sampled, round bales are necessary to have sufficient sample size for an analysis. Sample size should represent the larger of the two, either six bales or 20 percent of the number of bales in a lot.
Hay that is stored outside should be sampled just prior to the feeding period. Angle the core sampling tool in an upward direction when sampling large packages stored outside.
This will help avoid creating a hole for water to penetrate the inside of the bale. Avoid sampling excessively weathered material. The sample submitted should reflect what the cattle will be eating, not wasting.
Hay that is stored inside can be sampled at storage or prior to feeding, with the exception of hay that was harvested wet. Hay quality diminishes rapidly during storage if harvested at less than 80 percent dry matter.
Using results
Upon receiving the results from a forage analysis, the next step is to interpret the results. Results in a routine hay analysis report are often separated into two columns: as-fed basis and dry matter basis.
When comparing a forage analysis to animal requirements, the values reported under dry matter basis should be used. The following information is reported when a forage sample is submitted for routine analysis through the University of Arkansas Cooperative Extension Service:
• Moisture – Water content of a feed
• Dry matter – 100 minus the water content.
Used to convert as fed to dry matter. Example: 8.9 - 91.3 x 100 = 9.8.
• Crude protein – A measure of plant nitrogen multiplied times 6.25.
• Acid detergent fiber – A measure of plant cellulose and lignin. Acid detergent fiber is commonly used to estimate digestibility (TDN).
• Neutral detergent fiber – A measure of plant hemicellulose, cellulose and lignin. Neutral detergent fiber may also be used to estimate digestibility and is highly correlated with forage intake.
• Total digestible nutrients (TDN) – An estimate of the supply of energy. The number for total digestible nutrients is derived from equations developed from feeding trials.
Equations commonly utilize acid detergent fiber to estimate TDN but may also include crude protein and/or neutral detergent fiber.
• Net energy for lactation – An estimate of the supply of energy commonly used for balancing dairy cow rations.
A forage test cannot be interpreted without having a set of livestock nutritional requirements to compare against the results. Nutrient requirement tables are available through the county extension office for many classes of livestock.
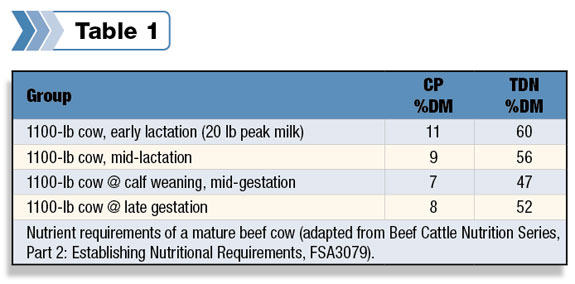
Table 1 contains the nutrient requirements for a mature beef cow during different stages of production.
Compared to the example forage test, the hay quality is sufficient to meet the nutritional requirements of both a cow in mid-gestation and late gestation.
A cow in early lactation would require both supplemental protein and energy (TDN) because a lactating cow’s requirement exceeds the amount in the hay, and a cow in mid-lactation would only require supplemental energy.
Hay is usually harvested at a mature stage, which results in a shortage in TDN for cows in early lactation. Forage test results were used to improve the economics of winter feeding on demonstration farms by:
• Matching hay lots with nutritional requirements of cows (feeding the best-quality hay to lactating cows and lower-quality hay to gestating cows).
• Identifying which nutrients were inadequate relative to beef cattle requirements and supplementing accordingly. Seventy percent of the hay samples from the demonstration were capable of meeting or exceeding the protein requirement of a mature beef cow in early lactation.
However, 70 percent of the hay samples were not capable of meeting the energy requirement of a beef cow during early lactation. As a result, supplemental feeding was shifted from emphasizing protein to emphasizing energy.
Summary
The time and money spent forage testing has consistently been shown to be a valuable tool for avoiding costly feeding errors. However, a forage test is of little value if the producer is not willing to interpret the results and make supplemental feeding changes when necessary. FG
Terry Davis, Mark Keaton, Sean Milliken and Scott Squires are county extension agents with the University of Arkansas.
References omitted due to space but are available upon request. Click here to email an editor.
—Excerpts from University of Arkansas Cooperative Extension fact sheet
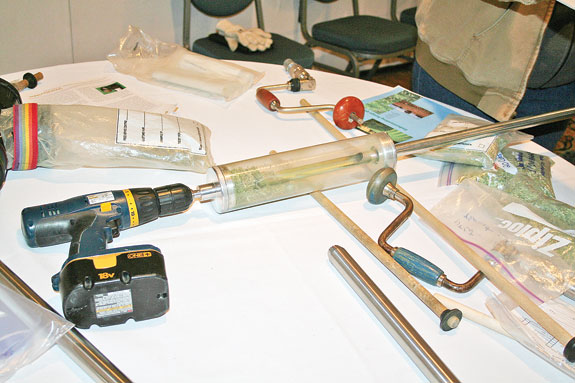
PHOTO
Various types of equipment is available to obtain core samples to return the most accurate results for hay testing. Photo courtesy of FG staff.