How does a producer determine his or her best opportunity for profit given the dynamic changes in yield and quality in different environments and cuttings?

The best strategy is to arm yourself with information such as past production and quality records, determine the current status of the forage crop and predict the future status of the hay crop. Then you have information to optimize the yield versus quality curves and negotiate the best price for your crop. My objective here is to outline a logical procedure to adapt cutting management to market conditions.
Rates of yield increase and quality decline
Premiums are paid for quality, but some of the higher price for increased forage quality is offset by lower yields of hay cut early for the higher quality. The best alternative is difficult to assess, since both alfalfa growth and change in forage quality vary considerably depending on environmental conditions – and because we have to forecast several variables.
Yield change per day around harvest time varies considerably and has ranged from zero to 200 pounds per acre per day. The daily yield increase will be less in cool, cloudy weather and if insects, disease or drought occur. It may be greater in periods of good moisture, sunshine and 75ºF to 85ºF weather.
Experiment 1: Yield and forage quality
Geoff Brink, U.S. Dairy Forage Research Center researcher, led a study to determine yield and quality changes in alfalfa hay. Yield increased more rapidly at Kimberly, Idaho, during the second and third harvest periods (180 pounds per acre per day) than during the first harvest period, at 120 pounds per acre per day.
Forage quality of first cutting in Idaho changed at a slower rate than in Wisconsin and Pennsylvania. Idaho was the only irrigated site. In Idaho, acid detergent fiber (ADF) increased 0.2, 0.3 and 0.5 percent per day during first, second and third cuttings.
The average change in relative feed value (RFV) in Idaho was -2.5 points per day for first cutting. In Midwestern environments, first cutting decreases about 5 points RFV per day, second cutting decreases 2 to 3 points per day, and third and fourth cutting during the growing season decline 1 to 2 points per day.
Thus, environment – primarily climate components such as air temperature and amount of sunshine – can result in profound differences in forage quality change.
The rate of increase within harvests over all harvest periods differed for ADF and neutral detergent fiber (NDF) in Idaho. ADF increased slower than NDF. ADF was not correlated to NDF digestibility (NDFd) at any harvest period in Idaho. However, a significant negative correlation was determined at all harvests in Pennsylvania and Wisconsin.
Therefore, determining the NDFd is especially important in Idaho. The late fall growth may change little in forage quality during mid- to late September and early October. Relative forage quality (RFQ) will change about the same as RFV on first cutting. In contrast to RFV, RFQ will show differences due to fiber digestibility in hot-season cuttings and decline about 3 points per day on second, third and fourth cuttings during the growing season.
Experiment 2: Yield
The average yields and rate of change by cutting across five years are shown in Table 1.
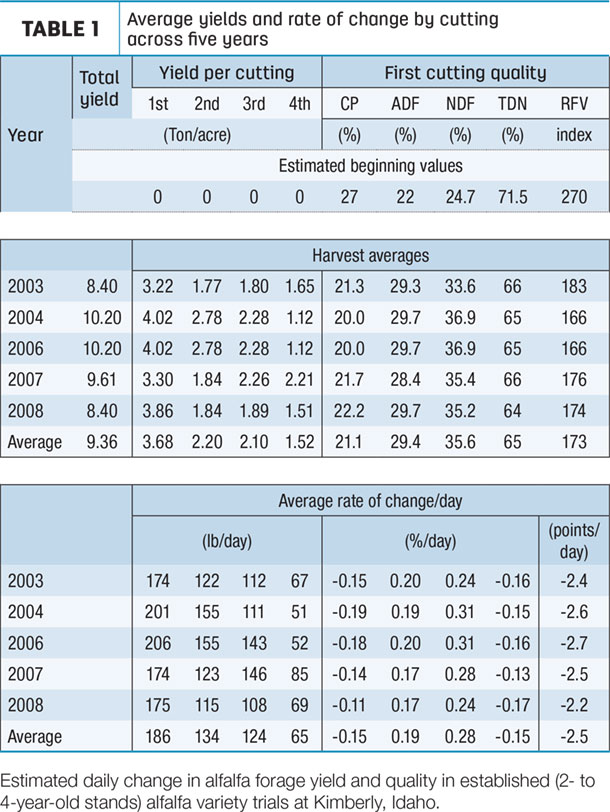 These are averages across all varieties, which represent over 1,000 data points in the University of Idaho variety trials at Kimberly. Forage dry matter yields averaged 3.7, 2.2, 2.1 and 1.5 tons per acre for first, second, third and fourth cuttings, respectively.
Yield increased an average of 186 pounds per acre per day for first cutting. Second and third cuttings averaged about 134 and 124 pounds per acre per day, and fourth cutting averaged 64 pounds per acre per day increase.
Experiment 2: Forage quality
The average of five years’ forage quality data in University of Idaho variety trials is shown for first cutting in Table 1. These calculations assume that, on average, frosts occur until April 15; thus harvestable growth starts then and, normally, we need to take first cutting by May 24 to meet dairy-quality hay criteria.
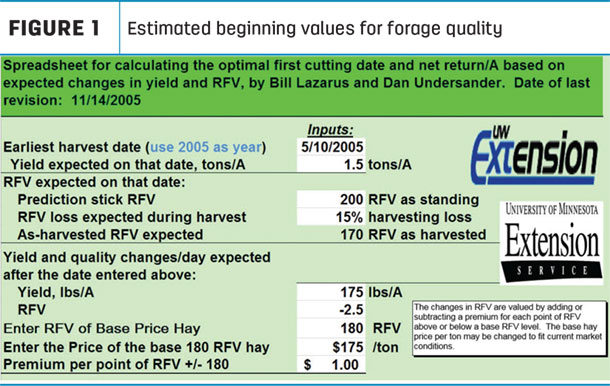
Note the estimated beginning values for forage quality in Figure 1. These are assumptions we don’t have much data to support, so be aware these are more based on opinion than on data.
 These values are from grab samples of fresh alfalfa, so be aware there is minimal leaf loss compared to drying in a windrow and being baled for hay. Harvesting alfalfa as dry hay usually has a loss of 10 to 20 percent of forage quality because of lost leaves.
I estimate crude protein declines by 0.15 percentage point per day to 21 percent crude protein on first harvest date. The fiber measurements increase at 0.19 percentage point ADF per day and 0.28 percentage point NDF per day. The total digestible nutrients declines by 0.15 percentage point per day, and RFV declines by 2.5 points per day for first cutting.
Using these predictions, alfalfa hay would decline about 1 percentage point in crude protein and total digestible nutrients in one week for first cutting.
Determining hay cutting date
Fact sheets and a spreadsheet to assist in determining hay cutting date are available from the University of Wisconsin to estimate optimum return based on yield and value of quality. Dairy-quality hay in the West is generally considered to be 180 RFV (RFQ) or higher, in contrast to the Midwest, where 150 RFV is used. Look up the fact sheets at:
Change in yield and quality of alfalfa
Measuring the trade off between alfalfa yield and quality across four harvest periods
You should input your own values in the “Calculations” tab of the Haycutdate.xls spreadsheet. I have entered south-central Idaho values as an example in Figure 1, and the default spreadsheet uses Midwest values. With your yield records, predict the yield expected on the earliest harvest date. Note: Use 2005 as the year, or the x-axis scale will be off and the graph won’t display.
Enter the RFV value expected on that date from the alfalfa prediction stick, the PEAQ method or from quality watch programs provided in several regions. The yield and quality changes per day need to be as accurate as possible, so refer to local extension publications or the quality watch programs. Enter the best information you have for the other input fields.
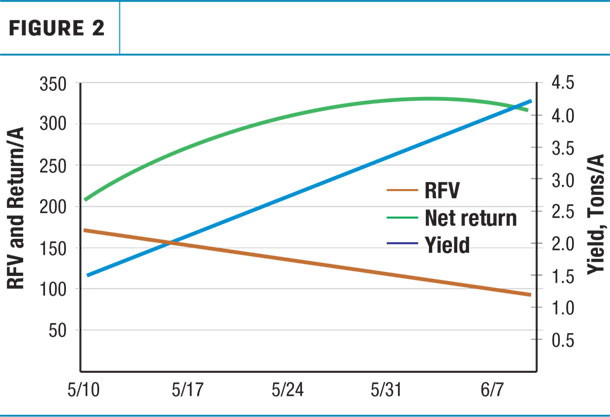
The “Sensitivity analysis” tab allows you to slide the bars to adjust yield, RFV, premium and cost adjustment for yield as shown in Figure 1. This will adjust the “Hay yield, nutritional quality and net return per acre as harvest date is delayed” graph (Figure 2).
This is a great tool Bill Lazarus developed so you can easily see the results when you change your harvest schedule and parameters.
The example shown in Figure 2 shows the rate of yield increase, rate of decline in forage quality using RFV and the net return curve based on an estimated value of hay. In my example, net return per acre is optimized by the “Profit-maximizing harvest date” of June 2.
Another way of expressing it is: The $1 per RFV point is not enough of a premium to justify cutting earlier. This should be your “eureka” moment that will give you information to negotiate a higher premium. This is also why I tell producers to avoid being stuck on this $1 per point of RFV because it is a static value in a dynamic situation. This may be especially important in the range of RFV above 160.
Information is power, so use it to be profitable. Enter your information and compare your results to these. Then you should be informed to adjust your cutting strategy and negotiate a fair price.
A strategy for alfalfa cutting management
There are several steps that should be taken to analyze for the best opportunity for profit:
1. Know your cost of production. It doesn’t cost much more to harvest a 3-ton yield than it does a 1-ton yield. When you know your break-even price, you know the price you must receive given the yield you can produce to meet the consumer’s criteria.
2. Keep and review past harvest records. Know your historic yield and quality for typical harvest dates.
3. Monitor yield and vegetative stage. The alfalfa prediction stick is a good tool to accomplish this for first cutting. Determine average height for the most mature stems in a field with the prediction stick and predict forage quality for that date.
4. Project the calendar date that will provide the forage quality required by the market criteria. You need to know the rate of change in yield and quality for that harvest period in your environment.
5. Adjust the projected cutting date to allow for the quality lost during harvest. For example, ADF usually increases 1 to 2 percent because of leaf shatter during hay harvesting.
6. Estimate the yield on that date.
7. Determine the projected profit or loss if marketed using that scenario.
8. Consider effects of early or late harvest on future cuttings and stand life.
9. Negotiate for the best profitability while balancing for stand life, reducing your risk and establishing a long-term relationship with a consumer.
Conclusion
The first harvest has the largest proportion of the annual yield; thus cutting management decisions on first harvest impact not only first cutting but subsequent cuttings.
Harvest management considerations are thus most critical for the first harvest period. Predicting the quality of subsequent cuttings is more problematic, so cutting on a calendar basis may be the best strategy for those cuttings. ![]()
References omitted but are available upon request. Click here to email an editor.

-
Glenn Shewmaker
- Forage Extension Specialist
- University of Idaho
- Email Glenn Shewmaker