Alfalfa production has always involved trade-offs between yield and nutritive value, and these trade-offs have only become more complicated with the introduction of reduced-lignin varieties. With field-wide maps, producers could more accurately determine the quantity of forage the field would produce and make decisions on whether waiting for more yield warranted the reduction in nutritive value from current levels.
It could also be possible to recognize the consequences of machinery management decisions on yield reduction caused by wheel traffic and change production practices to better optimize machinery use.
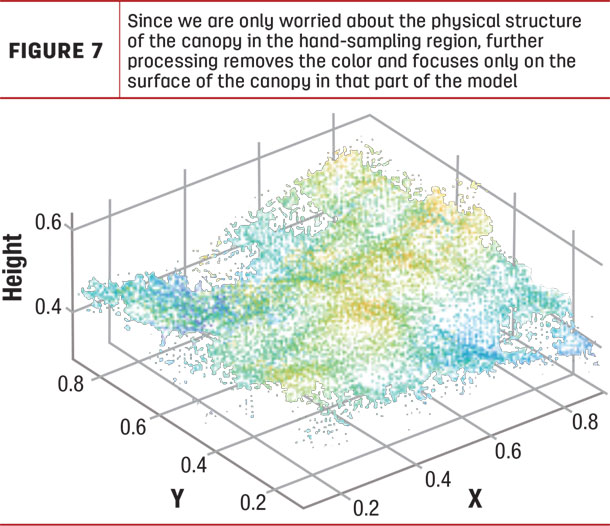
Both yield and nutritive value are correlated with the physical structure of alfalfa plants. Yield is dependent on the amount of plant material present. It is affected by plant height, stem density and leaf density, among other factors. Therefore, height alone is not sufficient.
Successful methods to estimate yield, like rising plate meters and Robel poles, have relied on measuring plant density with mechanical methods.
In contrast, height is a primary factor in estimating nutritive quality. As the plant grows taller, it must put more lignin in the stem to support the additional height. This additional lignin reduces nutritive quality. The PEAQ method of estimating quality relies on height and stage of maturity, but the multi-state experiments that created the PEAQ method found an equation based on height worked nearly as well.
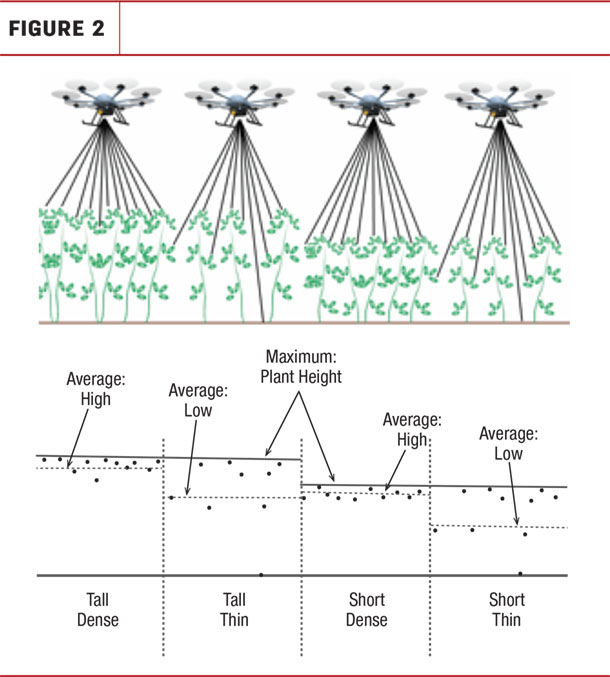
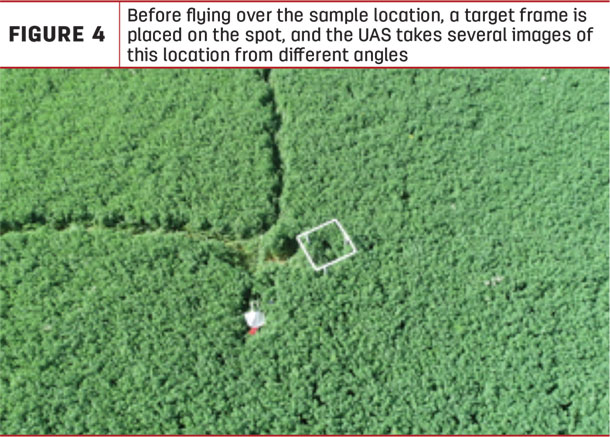
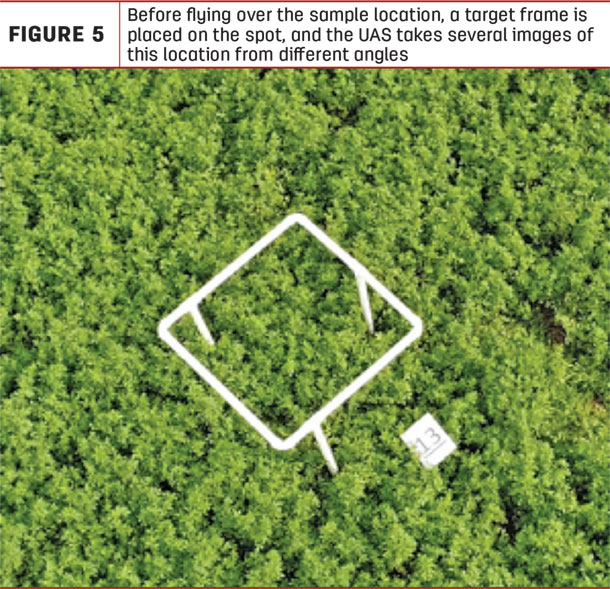
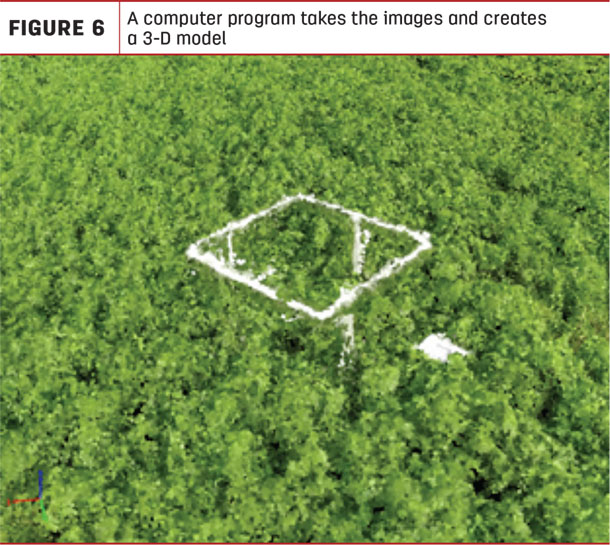
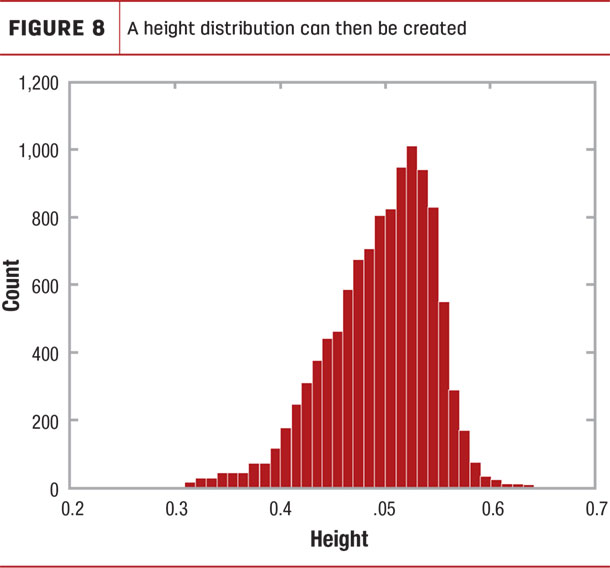
This project uses LIDAR and photogrammetry to measure the three-dimensional structure of the plants and attempt to estimate yield and quality. Photogrammetry uses images of the field canopy from multiple angles to generate a 3-D surface model that represents the canopy.
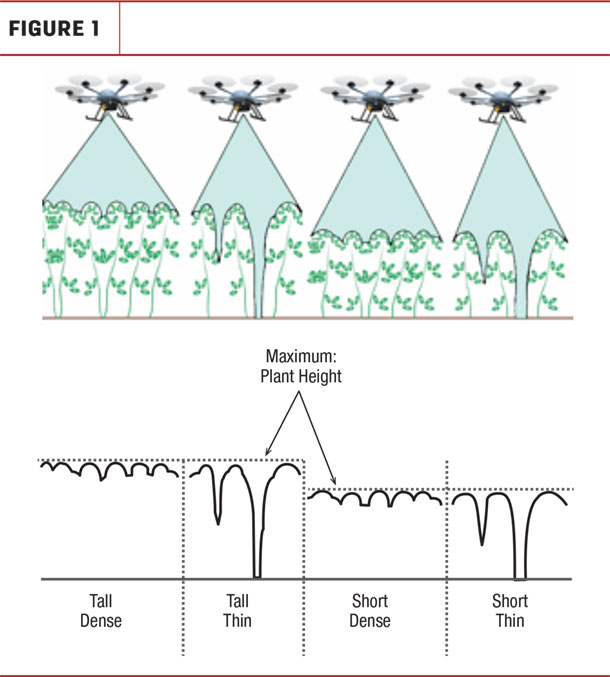
LIDAR systems rely on a spinning laser that determines the height of objects that intersect its path. Depending on the plant density, this laser will variously intersect the ground and plant materials.
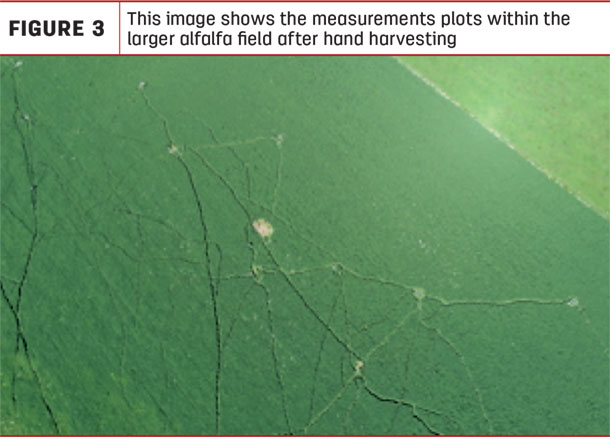
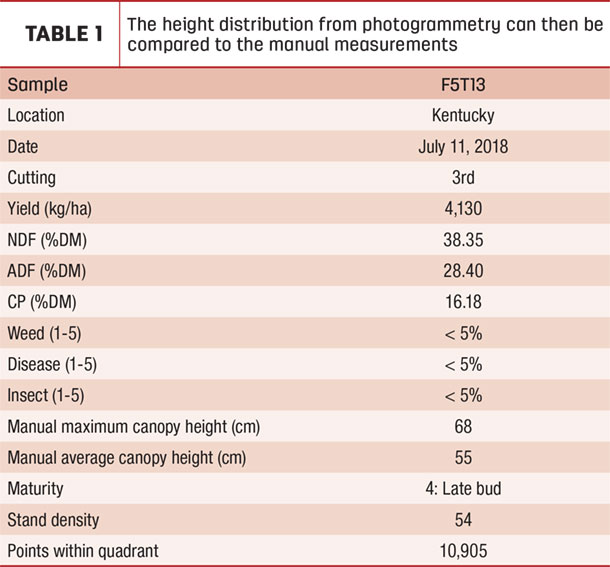
Experiments are currently underway to determine how well these systems can measure quality and yield. Last year, we focused on photogrammetry and flew over the fields weekly during the growing season. With each flight, we hand- sampled 20 plots to determine yield and quality. This year, we are adding a LIDAR measurement to this dataset. An example of the data processing method for photogrammetry is shown in Figures 3 through 8 and Table 1.
Both photogrammetry from camera imagery and LIDAR data collection systems are currently available on UAS. However, it is not yet known how to fly those systems to collect the level of detail needed to estimate crop condition correctly. We are also investigating the best way to process the three-dimensional structure information to match the yield and quality measures.
This project will continue until September of 2020. For the past two years, we have focused on collecting data from the sensors and creating algorithms that enable it to predict quality and yield. In the upcoming two years, we will focus on how to deploy these systems, how to use them to evaluate wheeled traffic damage and extension efforts. ![]()