There are numerous ag technology tools available that help measure plant biomass, the response of crops to various inputs and the profitability potential of each field.
This type of data collection and capture is fairly new to alfalfa and other forages. While yield monitors have collected grain data for years, forages haven’t had this type of capability on a large enough scale to enable robust examination of data and correlating it to what is occurring in the field.
We partnered with John Deere to evaluate alfalfa yield and quality on the HarvestLab program, Deere’s near-infrared data analysis on-the-go. Our goal was to begin putting metrics around forage quality coming off the field, much the same way a grain farmer would when pulling bushels at harvest.
We performed trials on eight alfalfa fields located on farms in Minnesota and Wisconsin. Four cuttings were made in each field, and the following were measured with the HarvestLab program: moisture, protein, acid detergent fiber, neutral detergent fiber and sugar.
After measuring, these components were mapped back to the field geospatially. The HarvestLab program yield monitor let us look at yield across the whole field, correlating the high-, medium- and low-production areas with respective yields. From there, we chose a specific site in each production level to monitor throughout the season.
The value of data
Valid forage data will help forage growers make better-informed decisions to more accurately answer questions such as, “Does this management practice add to my bottom line?” and “Can I manage my forage production to a higher level to increase yield and forage quality potential?” In addition to facilitating solid decisions, data helps enable growers to make these crucial decisions quicker.
Consider a fungicide application
One Wisconsin grower we worked with set up a trial to compare the effects of a fungicide to his first alfalfa crop. The data results showed it increased his plant health, resulting in a significant return on investment. As a result of the evaluation, he applied a fungicide to all his alfalfa for second cutting. Technology enabled this farmer to make a quick decision and improve his alfalfa production for the rest of the season.
Use quality information
Of course, yield or tonnage is an important characteristic we want to measure for forages. But quality is another critical component that can potentially be more valuable.
The other part of our research was to determine how quality information could be used to help forage growers make insight-driven decisions not only to boost yield and quality potential but also to assist in realizing potential economic benefits.
Here are ways we can help influence forage quality, yield, return on investment and sustainability potential in our trials.
Create variable-rate prescriptions
All areas of a field are not created equal; soil texture and soil quality may vary greatly. Each cutting pulls nutrients out of the soil that need to be replaced. In the past, a number of farmers have performed a one-size-fits-all broadcast application of fertilizer to replace what was removed.
However, the production areas of high, medium and low remove varying levels of nutrients from the soil. Applying fertilizer at the same rate over the entire field may not remedy those varying areas.
Using technology and geospatial maps allows growers to address these field differences. We can create variable-rate prescriptions as needed based on the maps and data collected. Currently, we use yield data to build prescriptions, but we are analyzing ways to incorporate the HarvestLab program’s quality components to help create a fine-tuned prescription.
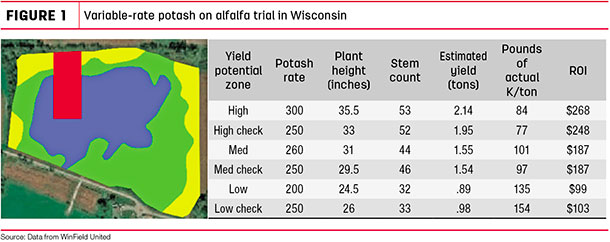
For example, if a grower averages 4.5 tons of forage for an entire field, he probably has some areas that only produce 3 tons and others that may produce 6 tons. Looking at things from a potash application perspective, potash removal difference is going to be roughly 300 pounds (removal rate estimate of 60 units of potassium per ton of forage produced) – a large amount of fertilizer and a significant cost for the farmer.
Creating variable-rate prescriptions, much like grain farmers would, can help forage growers apply crop inputs appropriately. By placing fertilizer on areas that need it most and avoiding over-fertilizing in less productive areas, farmers could strategically place fertilizer to help optimize alfalfa field production. Avoiding over-fertilizing certain areas will not only help control costs but may also help keep fertilizer in the soil.
Figure 1 indicates a summary of a 2017 Wisconsin on-farm trial of variable-rate potash on alfalfa.
Map out management zones
If you don’t have the capability to measure yield through a system such as the HarvestLab program, talk with your local agronomist or technology specialist about using a precision ag program. Several programs offer features such as in-season satellite imagery to help define high-production and low-production zones of your fields – many are available on your tablet.
Any farmer can participate in zone management or variable-rate nutrient management, whether they have the capability to measure it on their harvester or by using satellite imagery. Satellite imagery measures biomass – plant density and plant health – which correlates to what we are harvesting from forages: yield and quality. The variable-rate prescription is adjusted based on the imagery and data.
What’s next
We are working with the R7 Field Monitoring Tool and determining how alfalfa can be included in it. This tool helps farmers scout more efficiently and plan timely input applications more precisely by providing up-to-date crop information throughout the season. Forage growers and their agronomists can view field conditions on their tablets to monitor crop progress and promptly address field issues.
Additionally, the imagery in the tool helps give us a crop vigor or trend line for a field over time. This information allows for multiple satellite-derived imagery captures that help to see how an alfalfa crop is trending overall.
As an example, when using this tool to evaluate fields for winterkill or stand loss, we noticed certain alfalfa fields stagnated after breaking dormancy, with some starting to decline in biomass.
Because we had the ability to identify these declining fields, we were able to scout them and discovered additional stand loss due to intense weed pressure. This information allowed for a quick decision to rotate this stand out of production.
Some agronomists are also using the tool to identify optimal cutting times when biomass is high to help determine the first cutting date of the season.
Ultimately, the goal of any forage producer is to continually boost return-on-investment potential. Our research is aimed at helping forage producers improve the management of every acre, produce more feed per acre and feed more cows per acre, which can translate into greater economic benefits at season’s end. ![]()
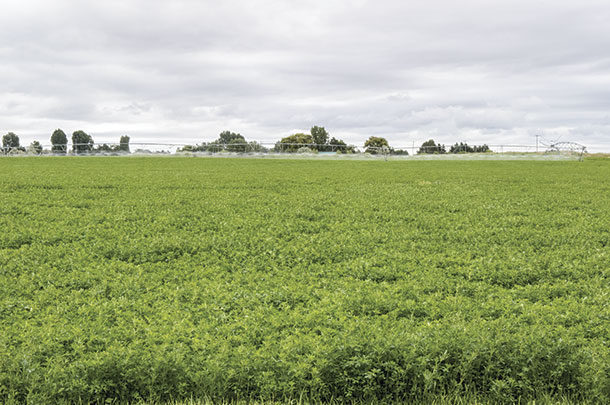
PHOTO: Irrigating alfalfa. Photo by Mike Dixon.
R7 is a registered trademark of WinField Solutions. HarvestLab is a trademark of Deere & Company.
Joel Johanningmeier is a technology manager at WinField United
R7 is a registered trademark of WinField Solutions. HarvestLab is a trademark of Deere & Company.