In the U.S., agriculture accounts for 80 percent of the nation’s consumptive water use, averaging over 90 percent in many Western states, according to figures from the U.S. Department of Agriculture (USDA) Economic Research Service.
But at the same time, demand for sustained global food security is spurring the industry to best itself with each growing season and market year, raising serious questions as to whether agriculture can reduce its water use while continuing to surpass previous production levels.
Some of those answers may be found in the latest irrigation data from the USDA. Every five years, the department’s National Agricultural Statistics Service agency conducts the Farm and Ranch Irrigation Survey (FRIS) as a supplement to the agriculture census. Results for the 2008 respondents from all 50 states are drawn from those reporting irrigation use in response to the 2007 Census of Agriculture. Not included were research, experimental and institutional farms.
Respondents were classified as belonging to one of two groups: a general FRIS group consisting of 23,089 operations, including irrigated forage acres, and a distinctly separate horticulture group, representing 9,996 operations reporting any sales of irrigated horticultural commodities.
Differences in how data was reported in the 2008 FRIS versus the 2003 survey mean state-level general FRIS data between the two surveys should not be compared on an apples-to-apples basis.
The latest survey shows U.S. farmers and ranchers are irrigating more farmland. According to the report, 54.9 million acres of farmland were irrigated in 2008, an increase from 52.5 million acres irrigated in 2003.
But while they are irrigating more land, they are also choosing different systems from those used in the past. Results from 2008 show more acres were irrigated with sprinkler systems – a climb of 15 percent to 30.9 million acres – than was true in 2003. Use of gravity irrigation continues to decline, down 5 percent to 22.0 million acres in 2008.
Along with that climb in acres came an increase in total quantity of water applied. In the five-year period between surveys, the total quantity applied increased by 5 percent to 91.2 million acre-feet of water. Based on the corresponding increase in acres irrigated, the average acre-feet applied by all methods remained the same as 2003 at 1.7 acre-feet (see Table 1).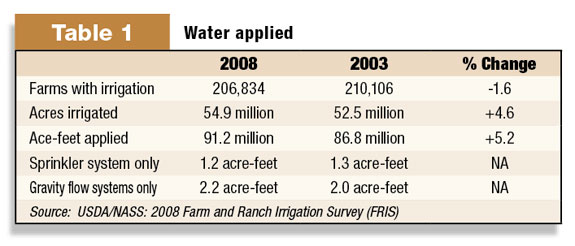
For the first time, questions dealing with reclaimed and recycled water were incorporated into the survey, according to Chris Messer, chief, NASS Census Planning Branch. Between 2003 and 2008, a total of 74,846 farms implemented changes in equipment or management practices that reduced energy use and/or conserved water. Nearly 46 percent of these farms reported reduced energy costs and 59 percent reported a reduction in the amount of water applied (see Table 2).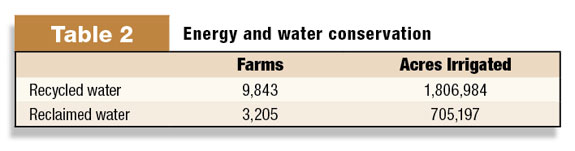
Additionally, in 2008 there were 152 farms that purchased a total of 94,472 acre-feet of reclaimed water at $28.48 per acre-feet.
Messer says that while historical comparisons lack some validity due to differences in how the survey was conducted, there is still a clear trend toward lower average acre-feet of water applied over the past 20 years.
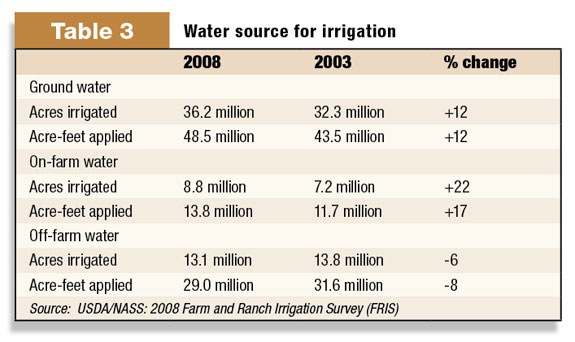
Another change seen between the 2003 and 2008 surveys is in the water source. The number of acres irrigated using ground water and on-farm water increased compared with 2003, while the number of acres irrigated using off-farm water decreased (see Table 3).
Results of the 2008 survey also showed agriculture had to dig a little deeper, the average well depth increasing 5 feet to a depth of 243 feet. The average depth to the bowls increased from 158 feet in 2003, to 166 feet in 2008. In addition, the average depth to water increased by 3 feet to 100 feet.
Messer points out that the price tag for irrigation has continued to climb. Farmers and ranchers spent $2.1 billion on expenses related to irrigation equipment, facilities, land improvements and computer technology in 2008. “Of those expenses, 50 percent were used for replacement of existing equipment, 35 percent for new expansions and 15 percent for water conservation,” notes Messer.
Total expenses for energy to power pumps increased a whopping 73 percent since 2003. With 12 percent more pumps used in 2008, the energy expenses for pumps totaled $2.68 billion (see Figure 1).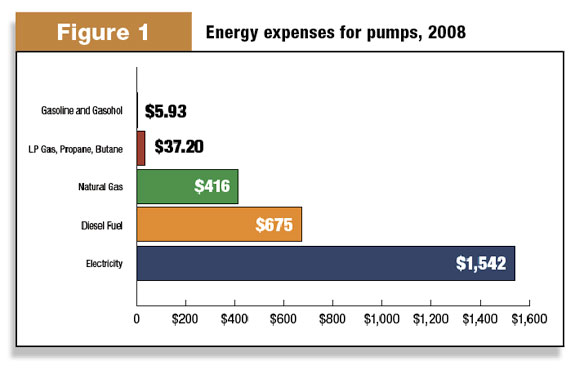
So are forage growers making progress in their efforts to conserve water and energy? “If you consider using fewer acre-feet of water since 1988 as a marker, then I would say yes, farmers/ranchers are becoming more efficient,” says Messer. “There are so many factors to consider in reviewing the report, especially since the data reflect responses from a sample of irrigation users, and of course weather conditions are variable. If we just look at the estimated quantity of water applied to alfalfa and alfalfa mixtures, we see a slight increase in average acre-feet of water applied – up to 2.4 in 2008 from 2.3 in 2003 – primarily by pressure systems, followed by gravity systems.”
She adds that economics play a major role as well in decisions regarding water and energy. One item to consider would be yield trends. Going back to 1909, alfalfa yields were 37.4 percent higher on irrigated land. “If we look at 1950, alfalfa yields were 3.06 tons on irrigated acres versus 1.74 tons on non-irrigated acres,” she points out. “In 2008, yield on irrigated acres was 4.5 tons per acres while yield on non-irrigated acres was 2.2 tons per acre.” Messer adds that while trends may be evident, there is difficulty in comparing figures from one year against another due to differences in the survey.
Forage growers interested in continuing to reduce their water use could make use of some of the data in the report in making their decisions, Messer adds. Data summarizing methods used in deciding when to irrigate (crop condition was the top reason given), energy and water conservation improvements, barriers to making improvements to reduce energy use or conserve water, and source of irrigation information used to reduce irrigation costs or to conserve water. Forage growers can compare the success of various practices in reducing water use, energy needs or other factors, for example.
She adds that data contained in the survey results can also be valuable tools for policy makers and government officials. Information related to number of irrigators participating in government programs, discontinuance of all irrigation by reason, and water rights are topics that may be of special interest to government agencies and offices. “It’s important to have sound statistics for policy and program considerations,” Messer adds.
With the 2008 FRIS results in hand, she is already looking ahead five years. “We need input as to what kind of information is helpful for the next FRIS,” she says. “We have a link, www.agcensus.usda.gov/Publications/2007/Census_Follow-on_Input/index.asp, to let voices be heard for improvements. I know it is important to continue the data series, but we also want to be relevant to the agricultural community and we need to hear from data users and providers as to what additional information is needed.” FG
Lori Weaver is a freelance author from Brooklyn, Wisconsin.