The energy policy shift
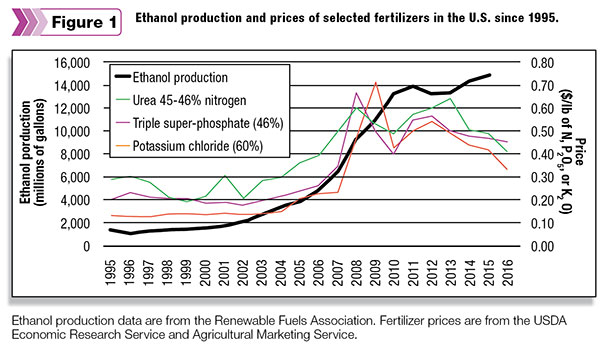
The two key pieces of legislation that caused these changes were the Energy Policy Act of 2005 and the Energy Independence and Security Act of 2007. The latter expanded the renewable fuel standard (RFS) set out in the former. The RFS legislated that biofuels (most prominently ethanol) must be increasingly used or mixed with gasoline sold in the U.S. Together, these acts mandated ramping up ethanol usage to a target of 36 billion gallons by 2022. The increase in U.S. ethanol production, as reported by the Renewable Fuels Association, is reported in Figure 1. Though ethanol production has not reached the 36 billion gallon level, and likely will not by 2022, it has nearly quadrupled over the course of the last 10 years.

In the agriculture sector, much focus has been placed on the implications of the RFS on biofuel production. Fertilizer prices skyrocketed in 2007-2009 and have plateaued over the last several years (Figure 1). Though there are many reasons fertilizer prices increased during this time, it is hard to ignore that the RFS had a major impact. After all, nearly all of this increased ethanol production came from corn. Since corn uses nearly 50 percent of all the fertilizer that is used in the U.S., the increased reliance on corn and expansion of corn acreage to meet the ethanol demand set out in the RFS contributed to the increase in fertilizer prices.
Increased natural gas production is driving down prices
Ironically, other policies in those initial pieces of legislation now seem to be moderating the impact of the RFS on fertilizer prices. The Energy Policy Act of 2005 deregulated several key aspects of natural gas and oil exploration and extraction, including exempting the fluids used for hydraulic fracturing (commonly known as fracking) from the Clean Water Act and the Safe Drinking Water Act. Though one could debate the merits of this deregulation, these policies have substantially increased domestic energy production. According to the U.S. Energy Information Administration, only 40 percent of the liquid fuels (petroleum, liquefied natural gas, etc.) consumed in the U.S. in 2005 were produced domestically, with the remaining 60 percent coming from imports. By 2015, nearly 80 percent of the liquid fuel consumed in the U.S. was produced domestically.
Much of this increase has been from increased liquefied natural gas production. Natural gas is among the most efficient energy sources used for the manufacturing of nitrogen (N) fertilizer. High N prices and an abundance of natural gas are leading to an expansion of N fertilizer production capacity both domestically and abroad. In October 2015, a CoBank industry report entitled "The Evolving U.S. Nitrogen Landscape" stated that 12 N fertilizer facility expansions are currently in the construction phase in the U.S. and this would add another 6 million tons of new domestic ammonia capacity over the next three years.
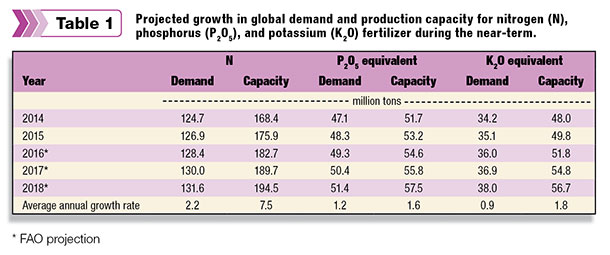
The increase in N supply appears to be occurring in many other countries as well. The overall world capacity to supply N is projected to grow at a rate that substantially exceeds demand for the next several years, according to the latest projections from the United Nations’ Food and Agriculture Organization (Table 1). Their projections are that global N production capacity will grow at a rate that is 3.4 times as fast as the global N demand is expected to increase. All other things being equal, this should place significant downward pressure on the N fertilizer price over the near term.
Other macronutrients seeing more neutral price pressure
The increase in phosphorus and potassium supply appears to be occurring at a more stable rate (Table 1). Global phosphorus production capacity is tracking growth in demand rather closely, and the supply appears stable over the near term. However, many have expressed concerns about the global phosphorus supply over the long term. Soil scientists and economists agree that phosphorus scarcity is likely, though there is not much precision in their estimates of when issues of scarcity are likely to become problematic. Most estimate that we have between 60 and 100 years of using phosphorus at current levels and at reasonable increases in demand (1 to 2 percent annually) before we face scarcity issues.
Though global potassium production capacity is growing at an annual rate that is twice the rate of demand, this may not translate to substantially lower potash prices. Between 75 and 85 percent of the potash used in the U.S. is imported, mostly from our Canadian friends. More stability in prices should be expected in the case of potash because of complex trade deals with Canada and tighter reins on production resulting from industry consolidation.
Projecting fertilizer prices is just about as accurate as projecting the weather. There are many factors at play. However, the overall picture appears to reveal a trend toward moderation in fertilizer prices over the near term. One might also expect more stability in year-to-year fertilizer prices as well. Such would be good news for the progressive forage grower. FG
Dennis Hancock is an associate professor and forage extension specialist for the University of Georgia. Email Dennis Hancock.


