Cropp says dairy product prices have been declining, which means lower milk prices. However, cheese prices may have bottomed and will perhaps show a little strength over the next month or two. Cropp says feed costs for dairies this winter will be a little lower than last year.

The USDA National Agricultural Statistics Service (NASS) released actual milk prices received for November 2015, which showed a 3 percent increase in milk prices over October 2015.
Market conditions reported Dec. 31, 2015
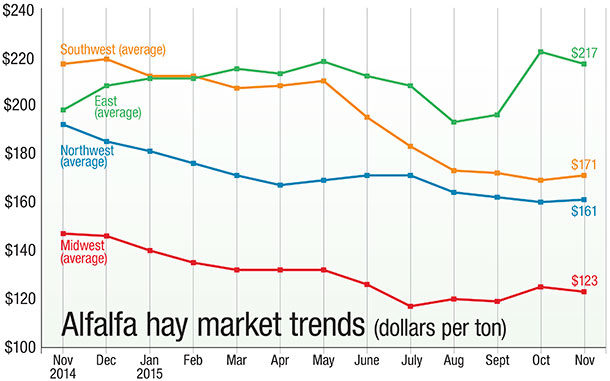
Actual prices received for November, as reported by NASS on Dec. 30, showed a decrease of 4 percent over October actual prices received for alfalfa hay. Hardest hit were Kansas and Minnesota (minus 12 percent) and Colorado (minus 11 percent). Idaho and Michigan saw significant price increases, however, with 13 percent and 11 percent, respectively. All states combined averaged a 4 percent decrease.
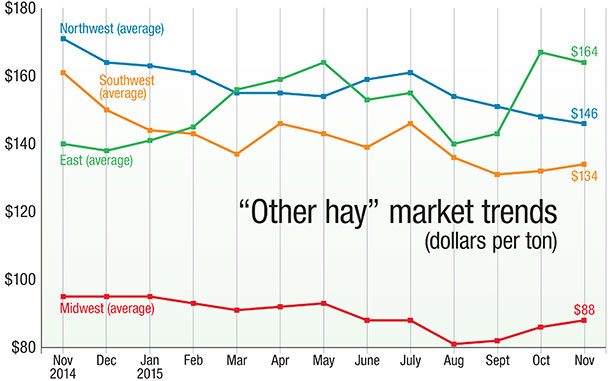
In the “other hay” markets, both negative and positive swings were wider. On the positive side, Michigan prices increased 21 percent, followed by Wisconsin and Minnesota at 19 percent and Arizona at 18 percent over October prices. Colorado again took a hit with a decrease of 17 percent, and Nebraska prices decreased by 13 percent over October. All states combined averaged a 2 percent increase.
Weather
Somebody ticked off Mother Nature. Living up to its name, winter storm Goliath dumped snow and ice on New Mexico, where the governor declared a state of emergency, before the storm moved through Oklahoma and Texas.
While eastern New Mexico received 2 to 3 feet of snow, the drifts were the bigger problem, reaching 14 feet in some places. It made it impossible for trucks to make milk deliveries in many places for up to 36 hours. Stock suffered as well, with death loss predicted at 5 percent.
San Antonio also received 2 feet of snow from the same system, with accompanying drifts and whiteout blizzards from high winds. The storm also brought heavy snow to California’s Sierra Nevada range, putting the snowpack above average for this time of year.
But it wasn’t done yet. Goliath picked up steam over the southern Plains and spread into the central and northern Plains, the Great Lakes region and parts of the Northeast. It’s responsible for the first snow accumulation of the season in Boston, Massachusetts, and Albany, New York. Tragically, before it was over, 23 people were killed across the country.
Backup waters from the Mississippi and Missouri rivers are blamed for at least 20 deaths in record flooding. Farms were evacuated, with stock and equipment finding new homes until floodwaters receded. Flooding incidents affect, as many of you know, the soil properties for years after the flood has receded.
Tired of hearing about El Nino yet? Its main impact will be felt December through March. Each El Nino is different, but this event is expected to be among the top three El Nino events since 1950. So far, the effects have included devastating fires in Indonesia (experiencing the greatest number of forest fires since 1997) and extreme warm waters stressing sea life with an intense coral bleaching event.
El Ninos have historically enhanced the hurricane season in the Pacific and depressed the Atlantic hurricane season. On the National Oceanic and Atmospheric Administration (NOAA) website, author Emily Becker says, “Phil Klotzbach of Colorado State University had this to say about the wild Pacific hurricane season: ‘So far this year, there have been a total of 21 Category 4 and 5 storms in the North Pacific, shattering the old record of 17, set in 1997. The North Central Pacific region (140-180W) has shattered records for most named storms, hurricanes and major hurricanes tracking through the 140-180W region.’”
How will El Nino affect your region – will your area be wetter or dryer, hotter or cooler? The predictions can be found on the NOAA website.
Exports
October export data was released, showing the top hay trading partners as compared with September figures, including Japan (10 percent increase), China (11 percent increase), South Korea (6 percent increase), United Arab Emirates (27 percent increase) and Taiwan (2 percent decrease). Saudi Arabia showed a 96 percent increase in exports over October, placing them sixth in quantity for hay exports in 2015.
Trend charts
Several forces can impact hay market trends – hay quality, interest rates, feed commodity prices, oil prices, crop input costs, weather, transportation costs, milk prices, inflation and international issues. The best way to understand market fluctuations is to study trends in relation to such events. There is value in keeping track of upswings and downturns over several months (or years) to help with buying and selling decisions. Thus, trends may become a critical barometer for producers, brokers, dairymen and livestock producers.
Furthermore, hay markets vary widely by region and by product – alfalfa hay versus “other hay.” The prices and information in Figure 1 (alfalfa hay market trends) and Figure 2 (“other hay” market trends) are provided by NASS and reflect general price trends and movements. Hay quality, however, was not provided in the NASS reports.
For purposes of this report, states that provided data to NASS were divided into the following regions:
Southwest – Arizona, California, Nevada, New Mexico, Oklahoma, Texas
East – Kentucky, New York, Ohio, Pennsylvania
Northwest – Colorado, Idaho, Montana, Oregon, Utah, Washington, Wyoming
Midwest – Illinois, Iowa, Kansas, Michigan, Minnesota, Missouri, Nebraska, North Dakota, South Dakota, Wisconsin FG