It’s generally a buyer’s market, as low grain prices and adequate hay supplies weigh on prices and demand is moderate to light. However, some sellers are refusing to budge, preferring to sit on limited supplies of top-quality hay to store it and sell throughout winter months. “No sale” is being reported on some low-grade hay offerings.

Here’s a snapshot of factors impacting hay producers as the calendar turns to October.
Drought areas remain widespread
USDA’s latest World Agricultural Outlook Board report indicates drought conditions improved slightly in some major hay-producing states in the Midwest and Mideast, but remained troublesome elsewhere. Parts of California, New York, Alabama and Georgia continue to experience the most extreme drought conditions. As of Sept. 27, about 15 percent of U.S. hay acreage was located in areas experiencing drought.
Check out the hay areas under drought conditions.
Hay production estimates coming
USDA hasn’t updated hay production estimates since August, but the next Crop Production report will be released Oct. 12.
August hay prices mixed
After several months of declines, U.S. average hay prices settled a bit in August, with wide price swings among states, according to the USDA National Ag Statistics Service’s (NASS) monthly ag prices report, released Sept. 29.
Alfalfa
The August 2016 U.S. average price paid to alfalfa hay producers at the farm level was $138 per ton, down $2 from July and $23 less than a year earlier. While U.S. and regional alfalfa hay average prices were at or near those the previous month (Figure 1), price changes for a couple of states were outliers.
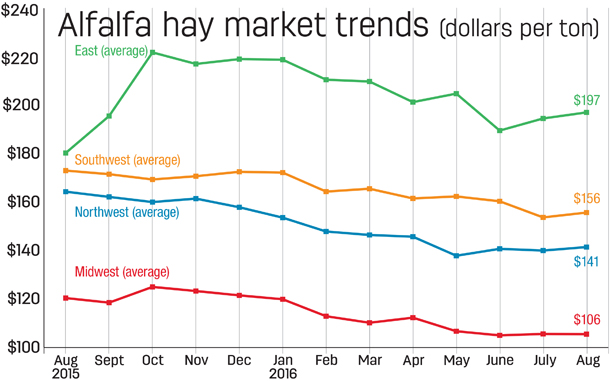
Compared with a month earlier, average prices were up $21 per ton in New York (to $216), $19 per ton in Pennsylvania (to $182) and $15 per ton in Michigan (to $155). In contrast, the average price was down $30 per ton in Ohio (to $170 per ton).
Only Kentucky, New York, Ohio and Wyoming saw prices higher than the same month a year earlier.
The highest August average prices were in Kentucky ($220 per ton) and New York ($216 per ton); lowest were in Minnesota ($69 per ton) and Wisconsin ($79 per ton).
Other hay
The August U.S. average price for other hay was $116 per ton, up $3 from July and $6 more than August 2015.
Led by New York and Pennsylvania (each up $24 per ton), the East saw the largest price increases compared to a month earlier (Figure 2), with all other regions reporting small price declines. Ohio and New Mexico paced decliners, down $15 and $10 per ton, respectively.
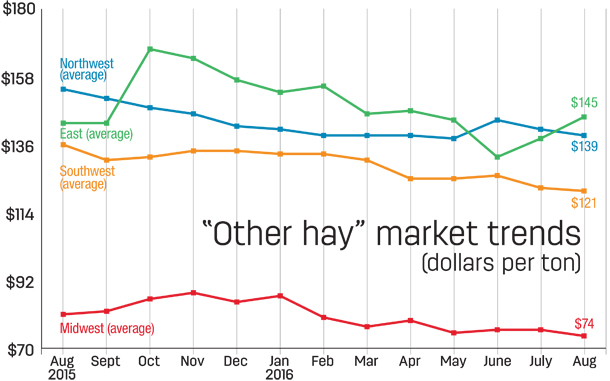
Compared with a year earlier, other hay prices were down $80 in Nevada, $35 in Colorado and $30 in New Mexico, Utah and Washington. Texas average other hay prices were up $46 per ton compared to a year earlier, with New York prices up $31 per ton.
Highest prices were in New York ($187 per ton), Pennsylvania ($182 per ton) and Oregon ($180 per ton); lowest prices were in Minnesota and Wisconsin (both $46 per ton).
Exports strong, but cloudy
U.S. alfalfa hay export volume grew in July, but the global market was thrown into a state of confusion in late August, impacted by the Zika virus as well as the bankruptcy of a global shipping company.
First, the Chinese government announced any shipping containers from the United States had to comply with special rules designed to halt the spread of Zika, a mosquito-borne illness. Compliance would have required additional disinfection, spraying, air curtains or other pest management techniques, adding shipping costs and delays. China later revised the mandate, saying only shipments from Florida must comply.
The world’s seventh-largest shipping company, South Korea’s Hanlin Shipping Co., declared bankruptcy, stranding cargo and ships. USDA’s Global Agricultural Information Network reported few of Hanlin’s vessels were devoted to bulk cargo, which should lessen the overall impact on U.S. agricultural exports.
Beating those concerns, U.S. alfalfa hay exports volume grew in July, topping 225,000 metric tons (MT) for the first time. Combined with May and June export volumes, it’s the highest three-month total on record. Despite lower prices, the jump in volume pushed the value of July alfalfa hay exports to $67.3 million, the highest total of the year.
At 116,815 MT, July exports of other hay rebounded slightly from June, but still came in as the third-lowest total of the year. Alfalfa cube and meal exports shipments were mixed compared to the previous month.
Alfalfa hay exports to China increased substantially compared to a year ago. Exports to Japan, the United Arab Emirates and Saudi Arabia also posted gains compared to July 2015. However, there are concerns China has now accumulated large inventories of hay, which could limit future purchases.
Dairy outlook: Cow numbers jump
It’s not over the moon, but the number of cows in U.S. dairy herds has jumped to a two-decade high. Combined with increased output per cow, estimated August 2016 U.S. milk production was up 1.9 percent compared to the same month a year earlier.
U.S. milk production was estimated at 17.735 billion pounds, up 1.9 percent from the same month a year earlier. Cow numbers, at 9.36 million head, were up 45,000 head, and production per cow averaged 1,895 pounds, 27 pounds more than August 2015.
Since falling below 9.2 million head in late 2013, U.S. cow numbers have been on a 32-month upward trend, reaching the highest total since the second quarter of 1996.
Largest year-over-year increases cow numbers were in Texas, Idaho and Michigan, with Colorado and South Dakota not far behind. Since slumping to 455,000 head after Snowstorm Goliath in December 2015, Texas dairy cow numbers are now at 487,000 head, an increase of 32,000 since February and up 12,000 compared to July.
Some of those Texas cows are migrants from California, where milk production continues to fall below year-ago levels, the result of fewer cows and less milk per cow.
Despite an increase in August, U.S. dairy cow culling through Sept. 10 was running about 1.3 percent behind the same period a year earlier.
Milk prices, which had a good run-up in recent months, aren’t holding, said Bob Cropp, professor emeritus at the University of Wisconsin-Madison. He forecasts Class III milk prices could fall into the mid-$15s per cwt in the fourth quarter of 2016.
Despite his less optimistic outlook for the remainder of 2016, Cropp forecasts 2017 milk prices should improve, with Class III back in the $16s per cwt, perhaps even reaching $17 per cwt by the fourth quarter.
Beef cattle outlook: Margins stay negative
Beef margins were mixed, but remained deeply negative during the first half of September. Cattle prices bounced slightly after reaching new lows in early September, although they are trading at essentially the same levels as in late August.
Cattle prices remain under pressure due to growth in beef production. USDA’s latest projections estimate 2016 beef production will be up 5.2 percent from 2015, with another 3.4 percent increase forecast for 2017. However, the current lack of economic incentive to expand the beef herd may cause the rate of growth to decline in upcoming forecasts.
Cattle and calves on feed in the nation’s largest feedlots totaled 10.1 million head on Sept. 1, 1 percent more than a year earlier. August placements totaled 1.88 million head, 15 percent more than August 2015. August fed cattle marketings totaled 1.87 million head, 18 percent more than a year earlier
August beef production, at 2.26 billion pounds, was 17 percent more than the previous year.
Figures and charts
The prices and information in Figure 1 (alfalfa hay market trends) and Figure 2 (“other hay” market trends) are provided by NASS and reflect general price trends and movements. Hay quality, however, was not provided in the NASS reports.
For purposes of this report, states that provided data to NASS were divided into the following regions:
Southwest – Arizona, California, Nevada, New Mexico, Oklahoma, Texas
East – Kentucky, New York, Ohio, Pennsylvania
Northwest – Colorado, Idaho, Montana, Oregon, Utah, Washington, Wyoming
Midwest – Illinois, Iowa, Kansas, Michigan, Minnesota, Missouri, Nebraska, North Dakota, South Dakota, Wisconsin ![]()

-
Dave Natzke
- Editor
- Progressive Forage
- Email Dave Natzke