September hay prices mostly steady
With supplies mostly plentiful, U.S. average hay prices found little reason to move off recent lows, according to the USDA National Ag Statistics Service’s (NASS) monthly Agricultural Prices report, released Oct. 31.

Alfalfa
The September 2016 U.S. average price paid to alfalfa hay producers at the farm level was $137 per ton, down $1 from August and $20 less than a year earlier. Average prices were down slightly across all regions (Figure 1).
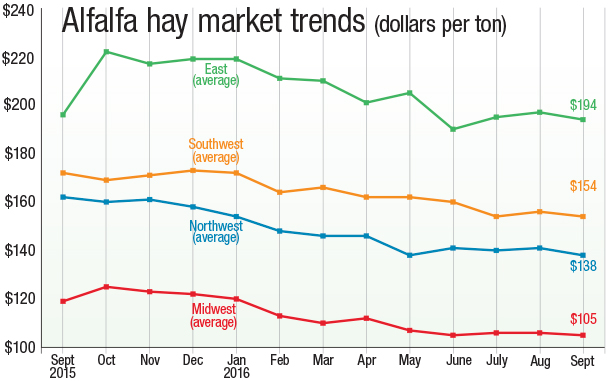
Producers in only a handful of states saw higher alfalfa hay prices in September compared with August, led by California, Missouri and Ohio (each up $10 per ton). Largest month-to-month declines were in New York (-$28 per ton), Nevada (-$15 per ton) and Michigan and Wyoming (each -$10 per ton). A couple of states saw alfalfa hay prices higher than a year ago, while many had prices $25 to $45 per ton less than September 2015.
Kentucky continued to be the price leader in September 2016, at $220 per ton, with New York, Ohio, Oregon, Pennsylvania and Texas between $33 to $51 per ton higher than the U.S. average price. Lowest average prices were in Minnesota ($69 per ton), North Dakota ($73 per ton), Nebraska ($77 per ton) and South Dakota and Wisconsin (both $88 per ton).
Other hay
Slightly lower prices in the Southwest offset small gains in the Northeast (Figure 2), resulting in a September U.S. average price for other hay at $114 per ton, down $2 from August and unchanged from September 2015.
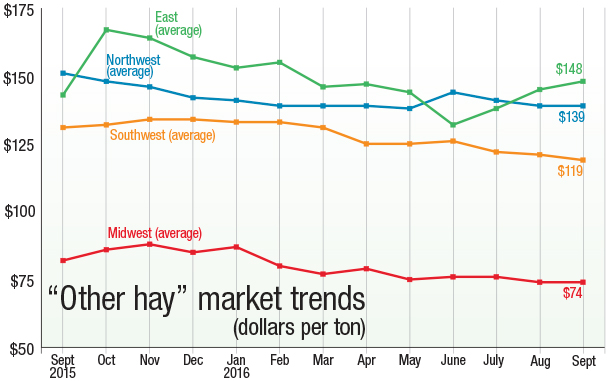
Among individual states, producers in Idaho, Ohio, Utah and Wisconsin saw double-digit gains of $10 to $15 per ton compared with a month earlier.
Compared with a year earlier, other hay prices were down $70 per ton in Nevada, $40 per ton in Colorado and $25 per ton in Michigan, Pennsylvania and Washington. In contrast, New York other hay averaged $49 per ton more than a year earlier, with Texas prices up $31 per ton.
Highest September 2016 prices were in New York ($187 per ton), Pennsylvania ($184 per ton) and Oregon ($170 per ton); lowest prices were in North Dakota ($58 per ton) and Wisconsin ($59 per ton).
Alfalfa exports hit new high
Clouds that began forming over the hay export market in September – the bankruptcy of shipping giant Hanjin and reports that China has developed substantial hay stockpiles – had not yet impacted August totals. Instead, with three major foreign markets setting highs for the year, U.S. alfalfa hay exports volume grew.
Alfalfa hay exports to China, Japan and Saudi Arabia were substantially higher, pushing the monthly world total to 247,888 metric tons (MT). Exports have topped 200,000 MT for four consecutive months.
Despite lower prices, the jump in volume pushed the value of August alfalfa hay exports to nearly $74.7 million, the highest total of the year.
At 120,015 MT, August exports of other hay continued a small increase for a second straight month. Exports of alfalfa cubes and meal also improved slightly.
More animals consuming roughages, but more hay, too
USDA’s latest Feed Outlook report estimated the number of roughage-consuming animal units (RCAUs) was up about 2 percent compared with a year earlier. However, an increase in hay production will offset those RCAUs, keeping available supplies of hay per RCAU steady.
USDA’s next Crop Production report will be released Nov. 9. The October report estimated 2016 production of alfalfa and alfalfa mixture dry hay at 62.8 million tons, up 7 percent from 2015. Based on Oct. 1 conditions, yields were expected to average 3.48 tons per acre, up 0.16 ton from last year. Harvested area was forecast at 18.1 million acres, up 2 percent from 2015.
Growing conditions in the western U.S., despite continued dryness, were better than in 2015. Favorable conditions had Corn Belt producers expecting improved yields over 2015. When the harvest is completed, record high yields are expected in Indiana, Iowa, Nevada, Washington and Wisconsin.
Among major producers, Arizona, Michigan, Nebraska, North Dakota and South Dakota appear to be taking the biggest dip in production compared to a year earlier.
Production of other hay was forecast at 78.8 million tons, up 4 percent from 2015. Based on Oct. 1 conditions, yields were expected to average 2.07 tons per acre, up 0.01 ton from last year. If realized, the 2016 average yield will be a U.S. record, and total production will be the third highest on record, behind only 2004 and 2003. Harvested area was forecast at 38.1 million acres, unchanged from the August forecast but up 4 percent from 2015.
Due to adequate moisture, most producers in the Heartland region were expecting improved yields compared with 2015. In the West, production was expected to be higher than 2015 due to the combination of either increased harvested acres or higher expected yields. Producers in Colorado, Idaho, Illinois, Missouri, Montana, Nebraska and New York were expecting record high yields in 2016.
Drought areas grow
USDA’s latest World Agricultural Outlook Board report indicates drought conditions spread in some major hay-producing regions, especially in an area stretching from eastern Texas to Georgia and Kentucky. Much of California and the Northeast continue to experience the most extreme drought conditions. Improved conditions were noted in the Northern Plains. As of Oct. 27, about 22 percent of U.S. hay acreage was located in areas experiencing drought, up 7 percent from a month earlier.
Check out the hay areas under drought conditions.
Dairy outlook: More U.S. milk coming
Global milk production may be starting to show signs of declining, but such is not the case in the U.S.
Nationally, September 2016 U.S. milk production was estimated at 16.967 billion pounds, up 2.1 percent from September 2015, and the largest monthly year-over-year gain since January 2014 and January 2015. September milk production in the 23 major states was estimated at 15.975 billion pounds, up 2.3 percent from the year before.
While the production news was mostly bearish and expected, the market did get some bullish news – retroactively.
After initially estimating August 2016 U.S. cow numbers at 9.36 million head, a two-decade high, USDA scaled back July and August cow numbers by 15,000 and 19,000, respectively. September U.S. cow numbers were estimated at 9.338 million head, 21,000 head more than September 2015, but 3,000 head less than August 2016. In the 23 major dairy states, cow numbers were estimated at 8.672 million head, 36,000 head more than September 2015, but 2,000 head less than August 2016.
USDA’s October World Ag Supply and Demand Estimates (WASDE) report foresees a lot more milk coming in 2016 and 2017, along with a weakening in projected milk prices.
There may be some signs of optimism. Domestic dairy product sales should remain strong, and export markets should see improvement as domestic and global prices move closer together. Voluntary milk production cutbacks in the European Union, along with weather-related declines expected in New Zealand, Australia and Argentina, are bringing world milk supply and demand into balance. It appears China will be more active in importing dairy products.
Beef cattle outlook: Supplies pressure margins
Beef producer income margins were steady to slightly weaker in the first half of October, according to the latest CIH Margin Watch report from Commodity and Ingredient Hedging LLC. Lower cattle prices and higher corn costs are applying pressure to both input and revenue sides of the equation.
The USDA raised beef production forecasts for 2016 and 2017 based on higher-than-expected slaughter. The large supplies of cattle and generally weak wholesale beef prices continue to pressure cattle prices in the near-term. There is also a growing sentiment that most of the bearish effects of record crop production have already been discounted by the market.
Cattle and calves on feed for the slaughter market in U.S. feedlots with capacity of 1,000 or more head totaled 10.3 million head on Oct. 1, up slightly compared with a year earlier. September placements totaled 1.91 million head (1.86 million net), down 2 percent from a year earlier and the lowest September total since USDA began estimating placements in 1996. September fed cattle marketings totaled 1.73 million, up 5 percent from a year earlier.
September U.S. beef production, at 2.18 billion pounds, was 4 percent above the previous year. Cattle slaughter totaled 2.62 million head, up 6 percent from September 2015. The average live weight was down 12 pounds, at 1,370 pounds.
According to USDA’s Cold Storage report, total pounds of beef in freezers were at a record high for September. When combined with competing meat protein sources, total red meat supplies in storage are the highest since data was first recorded in 1946.
Figures and charts
The prices and information in Figure 1 (alfalfa hay market trends) and Figure 2 (“other hay” market trends) are provided by NASS and reflect general price trends and movements. Hay quality, however, was not provided in the NASS reports.
For purposes of this report, states that provided data to NASS were divided into the following regions:
Southwest – Arizona, California, Nevada, New Mexico, Oklahoma, Texas
East – Kentucky, New York, Ohio, Pennsylvania
Northwest – Colorado, Idaho, Montana, Oregon, Utah, Washington, Wyoming
Midwest – Illinois, Iowa, Kansas, Michigan, Minnesota, Missouri, Nebraska, North Dakota, South Dakota, Wisconsin ![]()

-
Dave Natzke
- Editor
- Progressive Forage
- Email Dave Natzke