The declining cost of equipment and installation makes installing a behind-the-electric-meter (net-metered) solar electric system enticing for many agricultural producers.
Evaluating the financial prudence of an investment in solar requires careful consideration of installation costs, the value of production, and operation and maintenance costs. Unfortunately, some solar proposals are difficult to understand, lacking the information necessary to make fully informed investment decisions.
Third-party ownership structures, such as leases, further increase the challenge of understanding the viability of an investment.
Estimating system production
Producing renewable energy is much like farming: The quantity produced and the net value of the product determines profitability. If you grow more corn, more corn can be sold at the farmers’ market. Similarly, if you have corn for sale when others do not, then the corn can be sold at a higher price. The profit earned must consider the capital put into growing them and the ongoing inputs during the growing season.
Two similar components drive the return from a PV system: total amount of electricity produced and net value of that production. Since electricity is measured in kilowatt hours, the value of a solar installation is dictated by the number of kilowatt hours produced and how much they are worth after expenses.
The more kilowatt hours generated from an installation, and the higher the net value, the better the rate of return.
Your site-specific solar resource
PV installers should provide an estimate of production, typically separated into average monthly production. On a flat landscape, the climate, elevation and temperature determine the amount of energy produced by a PV solar system. Generally, the resource decreases as one moves from the equator to the poles, but local factors can significantly influence production.
For example, Laramie, Wyoming, is at approximately the same latitude as Cleveland, Ohio – but Laramie is sunnier, colder and higher; the same PV array produces 26 percent more electricity in Laramie than in Cleveland.
Site-specific factors are most critical to determine production and the ultimate value of a solar investment. Shading has the most visible negative impact on production. Shading effects will vary by season, often increasing as the sun angle becomes lower in winter months. Departure from true south also affects production, as panels facing east or west will generally produce less than the same installation facing due south.
The tilt (often roof slope) of the panels also influences production, as flatter angles will increase production in summer but decrease production in winter. Temperature can also affect production, as increased temperatures increase electrical resistance and reduce PV efficiency.
Most PV panels carry a 25-year warranty, but like most man-made objects, the sun will degrade PV panels over time. A typical warranty guarantees production declines will be less than 0.5 percent a year. A 25-year-old panel will produce at least 87.5 percent of original rated capacity of the system – a 10-kilowatt system would be 8.75 kilowatts in year 25.
These calculations are considered in the National Renewable Energy Lab’s PVWatts and System Advisory Model, but an installer should also account for these losses. The National Renewable Energy Lab’s tools and resources can quickly verify an installer’s estimates.
Assessing system cost
Investing in a PV solar energy system is a major investment that will influence the future profitability of a farm or ranch. In many ways, investing in a solar system is similar to purchasing new farm machinery. When investing in a new tractor, investors start by reassessing their needs for the tractor before researching various models, options and costs to determine the best option.
Whether considering a new tractor or PV solar system, the goal is to get the most return on the investment by maximizing the ratio between performance and cost.
Investors should carefully evaluate multiple quotes or project proposals when considering a PV solar system. Due to different variables and assumptions used to develop a PV solar proposal, evaluating proposals may seem like trying to compare apples to oranges.
Combining the total system cost with various savings, rebates, tax credits, grants and subsidies will further distort the actual investment. If necessary, do not hesitate to ask the installer to put the information in an easier-to-understand format.
Direct capital costs
Direct capital costs are those directly associated with the PV solar system and can be clearly assigned to a specific piece of equipment or components related to the project. Direct capital costs are included in the total system cost, which is an up-front cost incurred in year zero of the cash flow analysis.
Common examples of direct capital costs for a PV solar system include the solar panels, inverters and the balance of system components that typically includes racking, wiring, fuses, breakers and monitoring equipment.
As illustrated in Figure 1, the national average cost for utility-scale PV solar projects in 2013 was 11.2 cents per kilowatt hour.
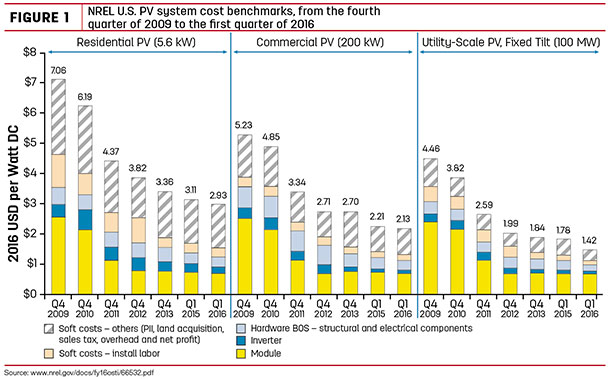
Direct capital cost accounted for 59 percent of the total costs including panels/modules (33 percent), inverters (9 percent) and the balance of systems hardware (17 percent).
Indirect capital costs
Indirect capital cost represents the soft costs associated with a project. Indirect capital costs are also included in the total system cost, which is an up-front cost incurred in year zero of the cash flow analysis. Common examples of indirect capital costs for a PV solar system include the installation costs (labor), grid interconnection, engineering, permitting, environmental studies and sales tax.
As illustrated in Figure 1, indirect capital cost accounted for 41 percent of the total installation cost in 2013. In most instances, the installation costs represent the largest indirect costs for small and mid-sized systems.
Operation and maintenance
Unlike direct and indirect capital costs that occur up-front, operation and maintenance cost represent the ongoing annual expenses required to maintain, service or replace critical components of a PV solar system.
Common examples of operations and maintenance costs for a PV solar system include re-torqueing electrical connections, replacing fuses, repairing broken or crushed wiring conduits and fittings, locating ground faults, resealing leaking junction boxes and repairing or replacing inverters and modules.
Proposals use various assumptions and can report operation and maintenance costs in many ways, including as a simple fixed annual cost, fixed annual cost proportionate to the system size (nameplate capacity), fixed cost as a percentage of the overall capital investment and a variable annual cost proportionate to the projected annual electrical production of the system.
The National Renewable Energy Laboratory suggests a fixed operations and maintenance cost of $19 per kilowatt per year for mid-sized (10- to 100-kilowatt) PV solar systems.
As an example, a 20-kilowatt PV solar system would allocate $380 per year ($19 x 20 kilowatts = $380) for operations and maintenance costs. Some proposals will apply an annual inflation rate and annual escalation rate to the operation and maintenance costs.
An escalation rate represents the estimated increase in operations and maintenance costs above the annual inflation rate due to the aging of system components.
Because there are no moving parts, low operation and maintenance costs are a benefit of PV solar compared to other renewable energy technologies; however, a comprehensive PV solar proposal will account for the operation and maintenance costs because they represent a real cost and are essential to maximizing a system’s production throughout its useful life.
Resources
For a more comprehensive discussion on rate structures, understanding incentives, forecasting the value of electricity and conducting a financial analysis, visit Energize Ohio, Ohio State University to read Solar Electric Investment Analysis, which is a six-part peer-reviewed publication. ![]()
Milton Geiger is energy extension coordinator with the University of Wyoming. Email Milton Geiger, and Benjamin Rashford is an associate professor with the department of agricultural and applied economics at Wyoming State University. Email Benjamin Rashford.
Eric Romich is an assistant professor, Extension Field Specialist – Energy Development at Ohio State University. Email Eric Romich.
Key questions to ask about solar solutions
- Is shading, orientation, angle and temperature included in production estimates?
- Does the lifetime production include annual declines from degradation?
- Can I easily identify the direct and indirect cost of the system?
- What is the installed cost per watt?
- Are the operations and maintenance costs included and clearly defined in the proposal?
- Is the value of electricity based on an average utility rate, or are fixed fees, demand changes and energy charges evaluated separately?
- What is the escalation rate used to calculate energy savings? Is it real or nominal?


